- Home
- ...
- Smarter Targeting of Erosion Control (STEC)
- Smarter Targeting of Erosion Control (STEC) News
Rain radar improves understanding of shallow landslide occurrence
In previous STEC newsletters, we described methods for producing landslide susceptibility maps1 and examined the extent to which use of LiDAR-derived digital elevation models (DEMs) improved the accuracy and resolution of these maps2. We have since published work comparing manual and automated methods of landslide data acquisition and susceptibility modelling3 and applied our models to predict susceptibility to shallow landslides for the Horizons1 and Hawke’s Bay4 regions.
In the current issue, we examine how rain radar can be used to better understand the occurrence of shallow landslides in response to high-magnitude storm events. Rain radar is a valuable tool that can help fill the gaps between sparsely located rain gauges in hill country areas. While we do not know when a particular landslide is triggered during a storm event, we can instead examine how the pattern of landslides varies spatially in relation to rainfall.
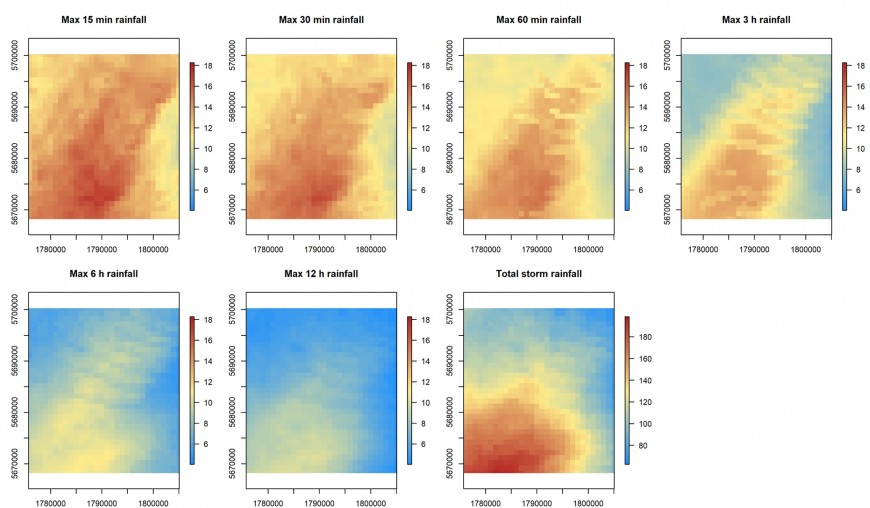
We focus on four storm events that generated large numbers of landslides within the Horizons, Waikato, and Auckland regions. We acquired high resolution (0.4-0.5 m) satellite or aerial imagery from before and after these storm events and mapped the location of every landslide within each study area. The pre-event imagery allowed us to exclude landslides that existed prior to each storm. MetService supplied radar data at 7.5 min scan intervals. We processed these data to generate gauge-calibrated grids of rainfall and computed maximum rainfall intensities over different durations as well as total event rainfall (Figure 1).

Figure 1: Maximum rainfall intensities (mm h-1) corresponding to selected durations and total storm rainfall (mm) from gauge-calibrated rain radar on a 1 km grid for the Whanganui study area.
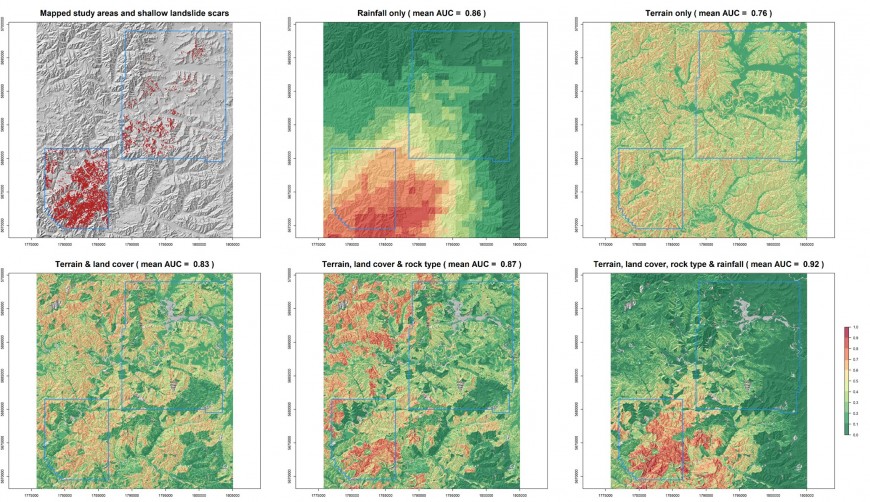
Rainfall grids, alongside other variables including slope, land cover and rock type, are available for potential inclusion in a binary logistic regression model. The data for these variables correspond to the locations of mapped landslides and randomly generated non-landslide points. We fit the model repeatedly with a cross-validation procedure that randomly partitions our data into separate training and testing sets. The fitted models are used to predict the relative likelihood of land instability for the event based on different combinations of input variables.
We can see in Figure 2 the ‘core’ of a storm event that triggered most of the landslides within an area in the Whanganui catchment, while fewer landslides occurred to the north-east based on mapping from intersecting pre- and post-storm satellite imagery. We can also observe how, for this storm event, use of rainfall data alone predicted landslide presence/absence at a level comparable to a model based on terrain, land cover and rock type data, as measured by the mean AUC (refer to the Figure 2 caption for explanation of AUC). Combining rainfall and landscape factors produced the most accurate representation of the spatial pattern in land instability associated with this event.
Work is underway to further analyse spatial rainfall data derived from rain radar to help us build a more comprehensive quantitative understanding of the storm and landscape conditions that trigger shallow landslides and predict potential landslide responses to storm rainfall scenarios.

Figure 2: Predicted susceptibility to landslide occurrence for the Whanganui study area based on different combinations of input variables. The red points in the top left plot indicate the location of mapped shallow landslides (n = 13,441) over a 15 m hillshade (LiDAR DEM was not available). The blue outlines indicate the mapping extent defined by available intersecting and cloud-free pre- and post-storm imagery. The mean AUC is a measure of model predictive performance in which a value of 1 equates to perfect landslide classification whereas 0.5 shows performance no better than a random guess. AUC values between 0.7 and 0.8 are typically considered acceptable, over 0.8 to 0.9 good, and over 0.9 excellent.
Further information
1Smith HG, Spiekermann R, Betts R, Neverman A 2020. Shallow landslide susceptibility analysis supports better targeting of erosion control. STEC Newsletter Issue 2, July 2020.
2Smith HG, Spiekermann R, Betts R, Neverman A 2021. LiDAR improves modelling of shallow landslide susceptibility for smarter targeting of erosion control. STEC Newsletter Issue 3, March 2021.
3Smith HG, Spiekermann R, Betts H, Neverman AJ. 2021. Comparing methods of landslide data acquisition and susceptibility modelling: examples from New Zealand. Geomorphology 381: 107660
4Smith HG 2020. A region-wide assessment of shallow landslide susceptibility in Hawke’s Bay. Landcare Research Contract Report LC3720 for Hawke’s Bay Regional Council
Key contacts

