- Home
- ...
- Smarter Targeting of Erosion Control (STEC)
- Smarter Targeting of Erosion Control (STEC) News
Modelling fine sediment dynamics in rivers to improve our understanding of impacts on streambed habitat and water quality
This is particularly important in New Zealand, where the National Policy Statement for Freshwater Management 2020 (NPS-FM, Ministry for the Environment 2020) introduced standards (‘target attribute states’), including ‘national bottom lines’ for two sediment metrics in rivers:
- visual clarity (measured as black disc visibility) to protect against suspended sediment damage (NPS-FM, Table 8)
- deposited fines (measured as percentage of streambed area cover) to protect streambed habitat (NPS-FM, Table 16).
The area of deposited fines cover is insensitive to particle size across the clay‒silt‒sand range, but visual clarity is very strongly dependent on particle size, since the most strongly light-attenuating particles are those near the clay‒silt boundary (2 mm).
Our understanding of fine sediment dynamics in rivers has recently been advanced by theory development and modelling of the deposition and entrainment of fine sediment, as reported by Haddadchi and Rose (2022) in Water Resources Research. Their model, based on the conservation of sediment mass, requires not merely suspended sediment concentration (SSC) data over storm events, or proxy concentrations via high-frequency turbidity (or acoustic) records, but also data on sediment particle size distribution across the silt‒sand range (2‒2,000 µm).

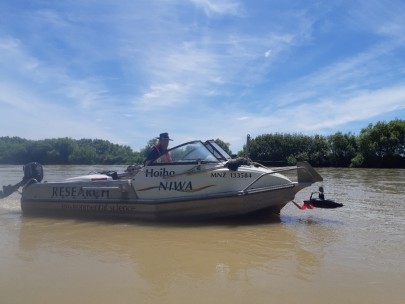
Figure 1. The Sequoia LISST-SL2 deployed from a NIWA jet boat during a large flood event in the Ōreti River, Southland, February 2020. The streamlined sensor (black instrument suspended from the boat crane) measures particle size distribution and provides suspended sediment samples at different depths through the water column. Andrew Wilsman, NIWA Dunedin, is at the jetboat helm. (Photo: Arman Haddadchi, NIWA Christchurch)
The reason that particle size distributions are so important to sediment behaviour (as well as their effects on aquatic ecosystems) is that different sediment sizes are entrained at different water velocities in accelerating flows, and fall through the water column (ultimately to be redeposited) at different rates in flow recessions. Concentrations of coarse silt and sand increase with depth in the river water and travel in so-called ‘graded suspension’.
Conversely, very fine sediment in the clay to fine silt range (<10‒20 µm), which most strongly affects visual clarity, settles so slowly that, once entrained, it mixes completely through the water column and then travels unhindered with the river water. The model handles this complexity by simulating separate particle size ranges, or ‘bins’.
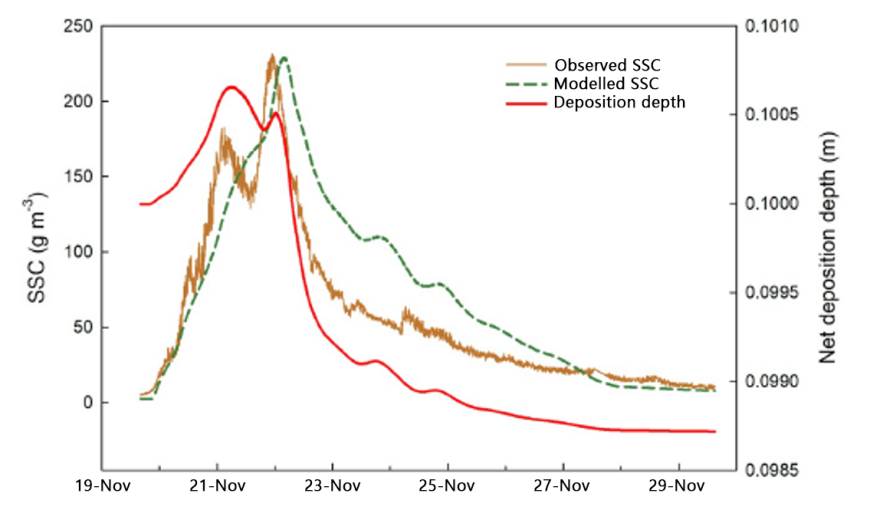
The new model was tested using measurements on the Ōreti River in Southland, a major test bed within the STEC programme. Comprehensive sediment sampling of storm flows at four sites along the Ōreti main stem included using a new instrument, the Sequoia LISST-SL2, to estimate particle size distribution (from the scattering of a laser beam) in real time as the sensor was lowered through the river water column from a boat crane (Figure 1). Data from a ‘calibration’ storm (Figure 2) were used to estimate parameters in the model, which was then applied to subsequent storm flows and found to provide estimates of sediment concentration and loads that agreed well with estimates based on high-frequency turbidity measurements.

Figure 2. Suspended sediment concentration (SSC) in the Ōreti River over the 22 November 2018 event used for model calibration. Also shown is the (modelled) depth of bed fine deposits (red curve). The modelled SSC (green curve) does not fully capture the measured pattern of SSC (brown curve, with two peaks), probably because the ‘observed SSC’ was obtained from the high-frequency turbidity record, which is most sensitive to the very finest particle size ‘bin’ (<24 µm) simulated by the model. (Source: Haddadchi & Rose 2022, Figure 4)
The model is now being applied to the Manawatū catchment (the main STEC test bed), where comprehensive sediment sampling and characterisation of storm flows, including measurements of light attenuation and particle size, have been carried out at three sites in Horizons Regional Council’s hydrometric network (STEC News, 4 May 2022). Sediment gauging over storm flows by jetboat has also been conducted at the key Teachers’ College site, with the Sequoia LISST-SL2 again used to estimate particle size distribution with depth through the water column. Model predictions of material eroded from the Manawatū catchment during rainstorms (using the TEST model framework, Dymond et al. 2019), will be introduced into second-order streams and routed downstream by the river sediment model, and predictions compared with actual measurements at river sites.
We expect that this cutting-edge research will provide new insights into the behaviour of fine sediment in rivers, and will eventually assist the management of erosion sediment to protect streambeds as habitat and the water quality of river waters and downstream receiving waters.
References
Dymond J, Herzig A, Smith H, Zoerner J, Basher L, Phillips C, Haddadchi A, MacDonald I, Zammit C, Davies-Colley R, Swales A. 2019. Event-scale soil-erosion and sediment-transport model for predicting water quality in rivers. Paper presented at the New Zealand Hydrological Society annual conference, Energy Events Centre, Rotorua, New Zealand.
Haddadchi A, Rose CW 2022. A physically based model of deposition, re-entrainment, and transport of fine sediment in gravel-bed rivers. Water Resources Research 58: e2021WR031782.
Ministry for the Environment 2020. National policy statement for freshwater management. Wellington, Ministry for the Environment.