- Home
- ...
- Smarter Targeting of Erosion Control (STEC)
- Smarter Targeting of Erosion Control (STEC) News
The influence of erosion sources on sediment-related water quality attributes
Most research on sediment in catchments focuses on understanding the patterns and drivers of erosion, sediment transport, and deposition with regard to the mass or quantity of sediment. In contrast, ‘quality’ aspects, notably particle size as it affects water quality, are not often evaluated, particularly in terms of their erosion source. This is problematic, because the physical qualities of sediment, which strongly affect environmental behaviour and influence water quality, may vary across catchments, geological parent materials, and erosion processes (Collins et al. 2011; Owens et al. 2005; Schjønning et al. 2017; Sklar et al. 2017), but are generally not considered when evaluating whether an erosion management strategy is likely to achieve the desired downstream outcome, such as achieving VC targets in the National Policy Statement for Freshwater Management (NPS-FM) (Hicks et al. 2019; Hicks & Shankar 2020; Ministry for the Environment 2020).

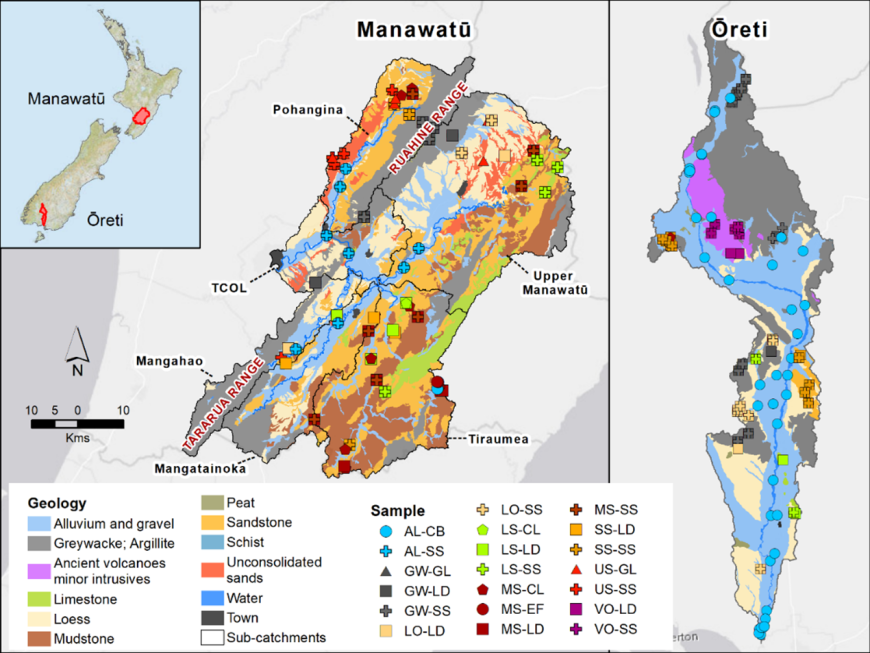
Figure 1. Manawatū and Ōreti (Southland) catchments showing parent material (geology) and sample locations.
We aimed to assess the extent to which sources, defined spatially according to erosion process and geological parent material in two New Zealand catchments (Figure 1), can be discriminated and classified by their sediment-related water quality (SRWQ) attributes. Samples were analysed for a set of SRWQ attributes related to particle size and organic matter. Light beam attenuation coefficient (beam-) was also measured and converted to beam- to use as an SRWQ attribute, given its importance for predicting VC.
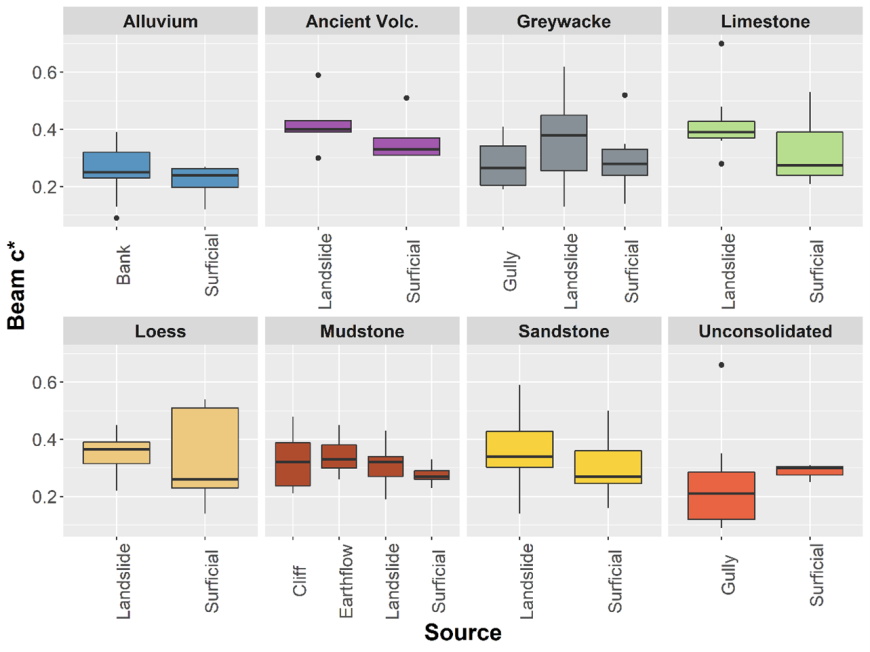
We found that SRWQ attributes showed significant variation across erosion sources. For example, beam- showed lower values for surface erosion relative to shallow landslide sources for most parent materials, while gully erosion occurring on unconsolidated sandstone/siltstone terrain had a lower value than all other erosion sources (Figure ). The extent to which attributes differed between sources often related to whether there was a strong association between a specific erosion process and the parent material. We also used a reclassification approach to reduce the 19 a priori source classifications down to five distinct sources (bank erosion – alluvium; mass movement – ancient volcanics; mass movement – sedimentary; surficial erosion; gully – unconsolidated sandstone).

Figure 2. Box plot distributions of light beam attenuation coefficient per unit mass (beam c*) according to erosion process and geological parent material.
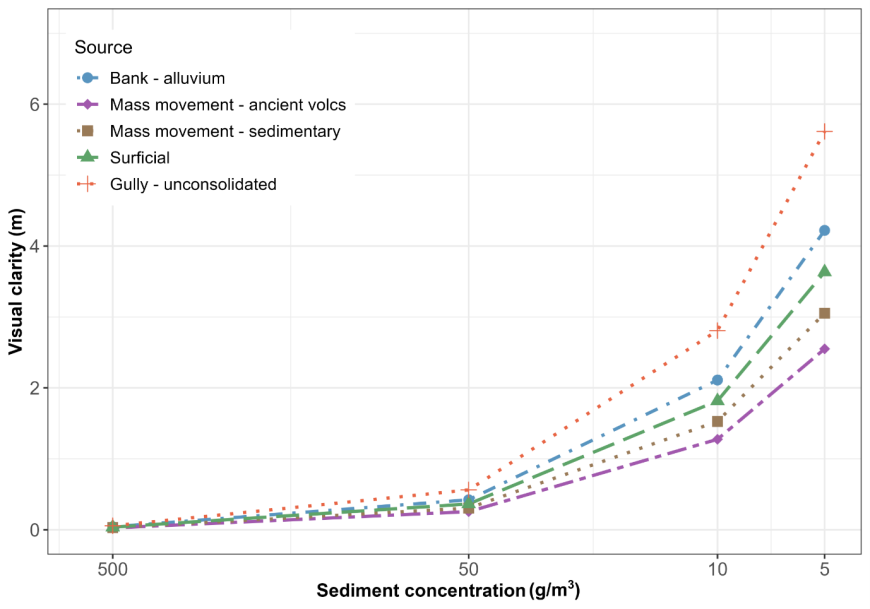
An empirical experiment was developed to show how different erosion sources might influence instream VC across different sediment concentrations (SC) (Figure 3). At higher SCs (e.g. during higher flows), the source of erosion is of less significance. However, the sediment source becomes increasingly important as SC decreases, and the influence of particle characteristics on the absolute VC becomes more apparent (i.e. VC can range from 2.6 to 5.6 m at 5 g/m3 [Figure 3]). This has important implications, because VC is of greater interest during lower flow conditions when people are undertaking recreational activities (e.g. swimming) and for aquatic biota that rely on sight to feed, forage, and hunt (Davies-Colley 2013; Kemp et al. 2011; Wood & Armitage 1997).

Figure 3. Estimated mean visual clarity (VC) from erosion sources at different sediment concentrations (SC). At low SCs the impact of erosion source on VC became most evident, ranging from 2.6 to 5.6 m at SC of 5 g/m3.
These findings begin to show how catchment sources of sediment, in addition to sediment concentration, influence VC, and highlight the need to consider quality as well as quantity of material supplied to stream networks when planning erosion control.
For further information and findings, see the full article: Vale SS, Smith HG, Davies-Colley RJ, Dymond JR, Hughes AO, Haddadchi A, Phillips CJ 2023. The influence of erosion sources on sediment-related water quality attributes. Science of the Total Environment 860: 160452.
References
Collins AL, Naden PS, Sear DA, Jones JI, Foster IDL, Morrow K 2011. Sediment targets for informing river catchment management: international experience and prospects. Hydrological Processes 25(13): 2112–2129.
Davies-Colley RJ 2013. River water quality in New Zealand: an introduction and overview. Ecosystem services in New Zealand: conditions and trends. Lincoln, NZ, Manaaki Whenua Press. Pp. 432–447.
Davies-Colley RJ, Vant WN, Smith DG 2003. Colour and clarity of natural waters. Science and management of optical water quality. Caldwell, New Jersey, reprinted by Blackburn Press.
Hicks DM, Haddadchi A, Whitehead A, Shankar U 2019. Sediment load reductions to meet suspended and deposited sediment thresholds. NIWA Client Report 2019100CH, prepared for Ministry for the Environment.
Hicks DM, Shankar U 2020. Sediment load reduction to meet visual clarity bottom lines. Memo prepared for Ministry for the Environment.
Kemp P, Sear D, Collins A, Naden P, Jones I 2011. The impacts of fine sediment on riverine fish. Hydrological Processes 25(11): 1800–1821.
Ministry for the Environment 2020. National Policy Statement for Freshwater Management 2020. Wellington, Ministry for the Environment.
Owens PN, Batalla RJ, Collins AJ, Gomez B, Hicks DM, Horowitz AJ, Kondolf GM, Marden M, Page MJ, Peacock DH, et al. 2005. Fine-grained sediment in river systems: environmental significance and management issues. River Research and Applications 21(7): 693–717.
Page M, Trustrum N, Gomez B 2000. Implications of a century of anthropogenic erosion for future land use in the Gisborne-East Coast Region of New Zealand. New Zealand Geographer 56(2): 13–24.
Schjønning P, McBride RA, Keller T, Obour PB 2017. Predicting soil particle density from clay and soil organic matter contents. Geoderma 286: 83–87.
Sklar LS, Riebe CS, Marshall JA, Genetti J, Leclere S, Lukens CL, Merces V 2017. The problem of predicting the size distribution of sediment supplied by hillslopes to rivers. Geomorphology 277: 31–49.
Vale SS, Smith HG, Matthews A, Boyte S 2021. Determining sediment source contributions to overbank deposits within stopbanks in the Oroua River, New Zealand, using sediment fingerprinting. Journal of Hydrology (NZ) 59(2): 147–172.
Westrich B, Förstner U 2007. Sediment dynamics and pollutant mobility in rivers: an interdisciplinary approach. Springer Science & Business Media.
Wood PJ, Armitage PD 1997. Biological effects of fine sediment in the lotic environment. Environmental Management 21(2): 203–217.
Key contacts


