- Home
- ...
- Smarter Targeting of Erosion Control (STEC)
- Smarter Targeting of Erosion Control (STEC) News
LiDAR data enables modelling of slope stability at the scale of individual trees
In previous STEC newsletters we showcased a newly developed landslide susceptibility model and evaluated to what extent LiDAR-derived DEMs could improve model performance. In this article, we demonstrate how statistical landslide susceptibility modelling can be used to quantify the mitigation effectiveness of trees at farm scale.
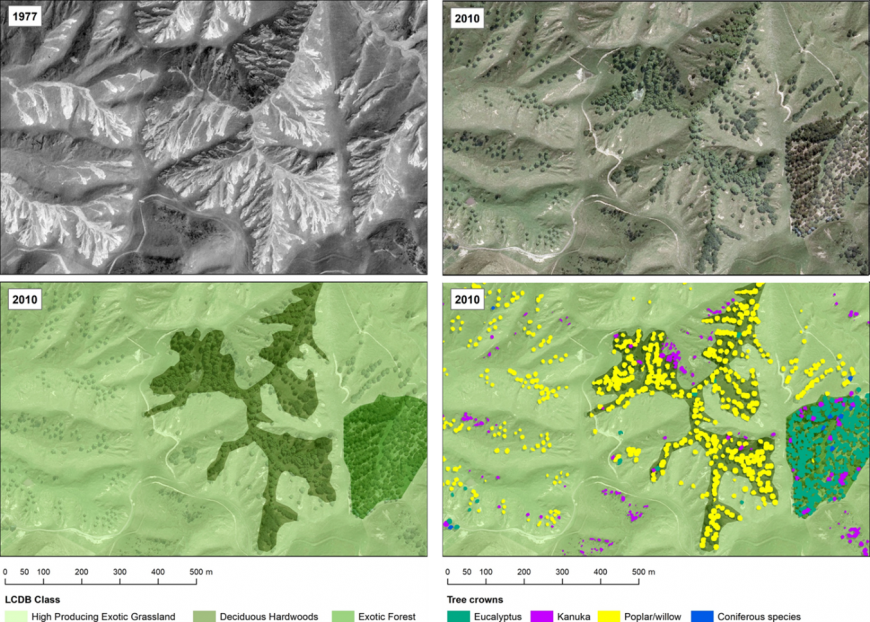
Widely spaced trees in New Zealand’s highly erodible pastoral hill country are an important mechanism for increasing slope stability – especially with respect to shallow landsliding. In most existing landslide susceptibility models, land use or land cover data (e.g. LCDB) are used to capture the varying effect of vegetation composition (Smith et al. 2021). Yet, these data are rarely available at the scale required to quantify the effect of individual trees across a silvopastoral landscape (Figure 1).

Figure 1. Many widely spaced poplars, willow, and eucalyptus trees (top right) have been planted on this farm in the Wairarapa in response to a devastating rainfall event in 1977 (shown in the historic aerial photo top left). The Land Cover Data Base of New Zealand (LCDB; bottom left) is not at the scale required to capture the effect of individual trees. LiDAR data enable individual trees to be identified and classified using high resolution imagery (bottom right).
We addressed this gap in scale by mapping and classifying trees using LiDAR data in combination with regional orthophotography (2010–2017) across an 840-km2 study area in the Wairarapa (Spiekermann et al. 2021). Subsequently, individual trees of multiple types (poplar/willow, eucalyptus, conifer, mānuka/kānuka) were included in a statistical landslide susceptibility model. Other variables used include LiDAR-derived slope gradient and aspect, as well as rock type. The landslide susceptibility models were trained and tested with cross-validation using an inventory consisting of 43,000 landslide scars and an equal number of randomly selected non-landslide points (Spiekermann et al. 2022).
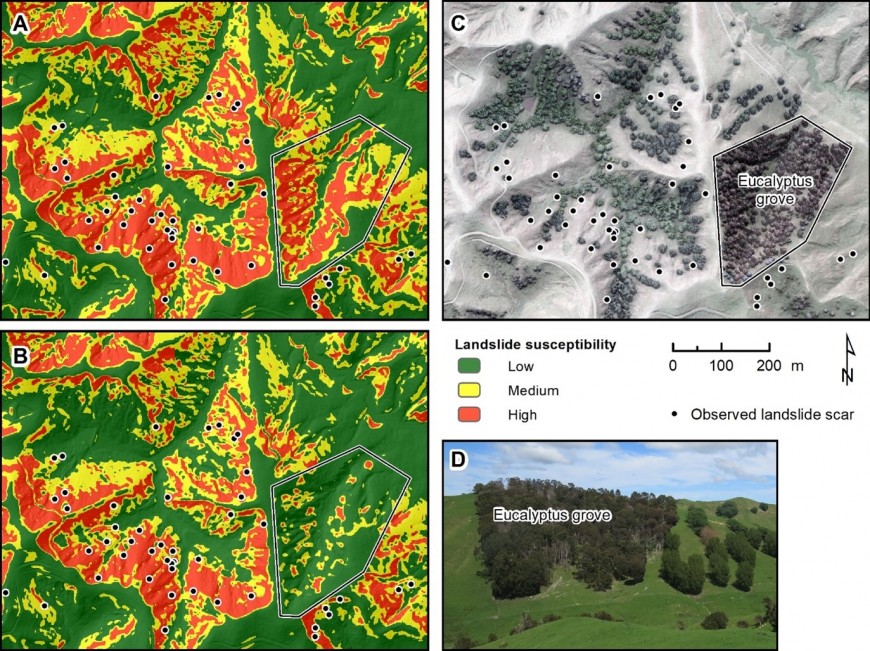
Spatial predictions in landslide susceptibility are illustrated for a small area in the Wairarapa (Figure 2). The maps provide a notable contrast between the eucalyptus grove to the east, which has been planted on highly susceptible terrain, and the poplars and willows to the west, which are largely located on lower slopes or valley bottom where landslides are unlikely to occur with or without the presence of trees. The effectiveness of individual trees in reducing landsliding was shown to be less a function of species than of targeting highly susceptible areas with adequate tree densities.

Figure 2. Spatial predictions of landslide susceptibility under (A) treeless pasture, (B) actual trees present in 2013 as shown in (C). The photograph (D) of the eucalyptus grove seen in (C) is courtesy of Ebony Davison. The landslide susceptibility classes correspond to expected rates of landsliding based on past observations: 80% in the red zone; 15% in the yellow zone; and 5% in the green zone.
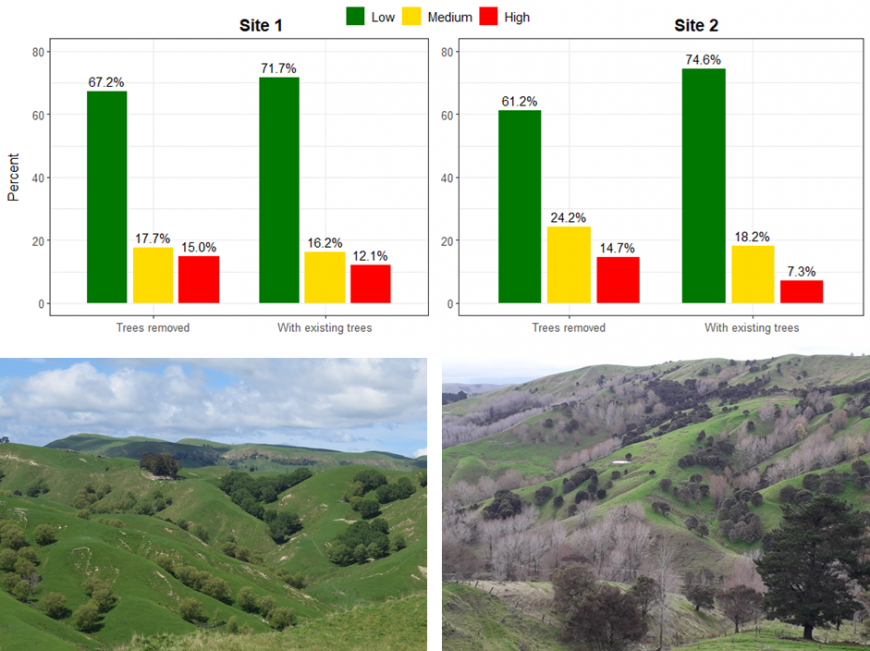
Two farms were selected to illustrate the application of the landslide susceptibility model at farm scale by quantifying the reduction in landsliding attributed to trees. Accounting for the rate of landslide erosion across the three different susceptibility classes (Figure 2), landslide erosion has been reduced by 17% at Farm 1 and 43% at Farm 2 due to all trees present on the farms (Figure 3). We found that the areas of highly susceptible slopes where the majority (80%) of landslides are expected to occur occupy just 12% and 7% of Farms 1 (1,700 ha) and 2 (462 ha), respectively. This suggests there is great potential for smarter targeting of erosion mitigation.

Figure 3. For two selected farms, the distribution of the landslide susceptibility classes under a) treeless pasture and b) actual existing trees. The change in the distribution amounts to a 17% reduction in landslide erosion at Site 1 and a 43% reduction at Site 2. The photos below provide a visual explanation for these differences: Site 1 has much lower tree densities than Site 2.
The results of this research demonstrate that LiDAR enables new higher-resolution data collection and analysis, including at the scale of individual trees. In a world-first, individual trees were included in a statistical landslide susceptibility model, resulting in greater accuracy and spatial refinement of the susceptibility maps. Landslide susceptibility provides a data-driven approach to erosion mitigation. The resulting high-resolution maps can be used for both mitigation planning and evaluation of effectiveness at farm to catchment scale and complement regional-scale approaches to landslide susceptibility based on national datasets (e.g. LCDB; Smith et al. 2021b).
References
Smith HG, Spiekermann R, Betts H, Neverman AJ 2021. Comparing methods of landslide data acquisition and susceptibility modelling: examples from New Zealand. Geomorphology 381: 107660. https://doi.org/10.1016/j.geomorph.2021.107660
Spiekermann RI, McColl S, Fuller I, Dymond J, Burkitt L, Smith HG 2021. Quantifying the influence of individual trees on slope stability at landscape scale. Journal of Environmental Management 286: 1–18. https://doi.org/10.1016/j.jenvman.2021.112194
Spiekermann RI, Smith HG, McColl S, Burkitt L, Fuller IC 2022. Quantifying effectiveness of trees for landslide erosion control. Geomorphology 396: 1–16. https://doi.org/10.1016/j.geomorph.2021.107993
