A comprehensive model framework, TEST (Temporal Erosion and Sediment Transport), is being developed in STEC to link river suspended sediment and related water quality to catchment erosion. TEST operates at the event scale with a focus on the stormflows that convey most sediment. In the Manawatu catchment, measurements have been made of sediment quality as well as quantity over stormflows to provide suitable data for calibrating TEST.
We sampled suspended sediment and related water quality at three sites in the Manawatū catchment within Horizons Regional Council’s hydrometric and state-of-environment river monitoring network (Figure 1). The main-stem river was sampled at the Teachers College (TCOL) site in Palmerston North, and two major tributaries were also sampled: the (‘muddy’) Tiraumea River at Ngaturi (NGA) on the east side of the main divide, and the (‘sandy’) Pohangina River at Mais Reach (MAI) on the west side, closer to Palmerston North. Stormflow water samples were analysed by the NIWA-Hamilton Water Quality Laboratory for standard sediment concentration metrics, but also for several sediment quality metrics characterising organic content, particle size and light attenuation of river suspended sediment (Table 1). The river stormflow sediment analyses were identical to analyses of soil samples, because we want to explicitly link river sediment to erosion sources.
 and Tararua (SW) ranges, to enter the Tasman Sea at the left")
Table 1. STEC laboratory analyses over stormflows at three sites in the Manawatu catchment.
| Analysis | Method | Rationale |
| SSC | Suspended sediment (sand + silt + clay) concentration – calculated from the weight of residue captured on a glass fibre filter. The mud fraction (clay + silt), passing a 63 mm sieve, was also analysed. | SSC quantifies sediment mass concentration. The finer silt + clay (‘mud’) fraction causes most light attenuation, so was analysed as well as SSC. |
| POC/PON | Particulate organic carbon – and nitrogen. Measured on the residue captured on a glass-fibre filter (acidified to drive off inorganic carbon as CO2); Analysis of combustion gases was by Elementar C-N-H analyser. | Quantifies organic carbon and nitrogen content of suspended particulate matter (Organic content of sediment affects its environmental behaviour and effects on aquatic life.) |
| Particle size | EyeTech laser streaming (time-of-transit) analyser (before and after ultra-sonic dispersion). | Quantifies in situ (flocced) and primary particle size distribution (PSD) – permits modelling of different sediment size ‘bins’. |
| Beam-c | Light beam attenuation coefficient measured by beam transmissometer (250 mm path, 530 nm green light) | Quantifies light (beam) attenuation, a fundamental optical property. Beam-c can be rigorously converted to visual clarity. |
Eleven river stormflow events were sampled over more than two calendar years. Unfortunately, conditions have been uncommonly dry and few large events, approaching annual flood size, have been sampled. However, the data we have collected seem to be of good quality, and should provide an excellent basis for implementing the river sediment component of TEST – allowing for a degree of extrapolation for very large (highly turbid) events.
Figure 2 shows example hydrograph data collected over a storm event peaking on 10 November 2020 on the main Manawatū at the Teachers College (TCOL) site. Both light beam attenuation (beam-c) and suspended sediment concentration (SSC – the concentration of suspended clay + silt + sand) are predicted reasonably well from the high-frequency turbidity record – although the SSC measurements on stormflow samples collected over this particular event (brown dots) tend to be higher than predicted from the long-term (overall) relationship with field turbidity (Figure 3).
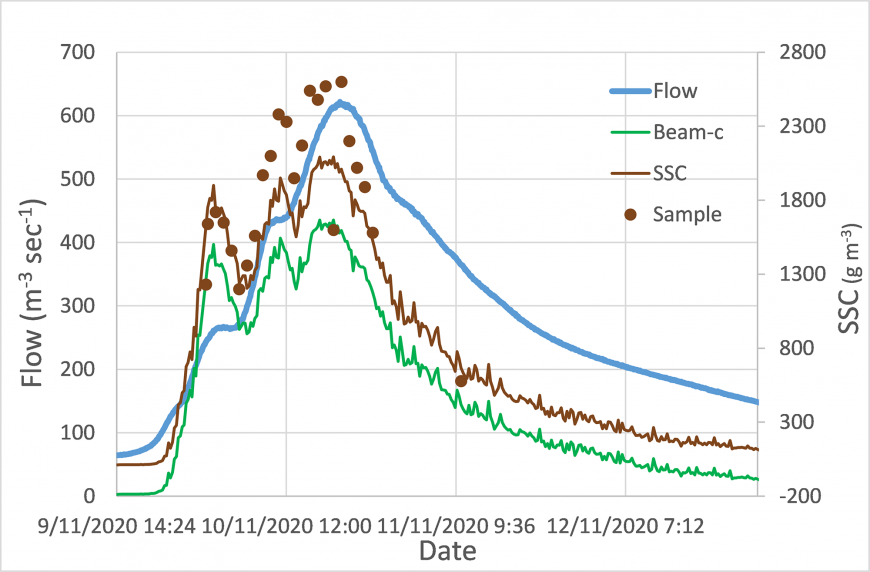
Figure 2. Dynamics of sediment concentration and associated light attenuation over a flood event in the Manawatu River. Data are for the Teachers College site (TCOL, within Palmerston North) on 10 November, 2020. The blue line is the discharge hydrograph, and the brown line is sediment concentration (SSC) estimated from calibration of the high-frequency turbidity sensor. Actual measurements of sediment concentration on auto-samples collected over the event (brown dots) tend to be higher than estimated (from the long-term relationship given in Figure 3) owing to relatively high sand content. The green line is the light beam attenuation coefficient also estimated from field turbidity (See Figure 4).
Figure 3 shows the total suspended sediment concentration (clay + silt + sand) and also the mud fraction (clay + silt), which dominates light attenuation. The mud concentration is more closely related to field turbidity than SSC because of variation in sand content. (Sand contributes appreciable mass but attenuates light very weakly so contributes negligible turbidity.)
 plotted versus field turbidity over 11 stormflow events in the Manawatu at Teachers College. The mud concentration (green) is appreciably more closely related to turbidity than SSC (blue) becaus")
Figure 3. Measurements of SSC and its mud fraction (TSS-mud) plotted versus field turbidity over 11 stormflow events in the Manawatu at Teachers College. The mud concentration (green) is appreciably more closely related to turbidity than SSC (blue) because the (variable) sand fraction contributes appreciable mass but negligible light scattering.
Measurement of light beam attenuation (beam-c), which can be used to accurately calculate visual clarity, is a novel aspect of the STEC river monitoring (Table 1). Beam-c measurements were used to calibrate the high-frequency field turbidity sensors operating at each site. Figure 4 shows beam-c plotted against field turbidity for the three STEC sites in the Manawatu catchment. As expected, beam-c typically provides an excellent calibration of high-frequency field turbidity. The rather higher degree of ‘noise’ (shown by a lower R value) at Teachers College than at the two tributary sites may reflect mixed sources of sediment, including contributions from the ‘muddy’ Tiraumea and ‘sandy’ Pohengina tributaries in varying ratios.
 over stormflow events plotted versus field turbidity at three STEC sites in the Manawatu Catchment.")
Figure 4. Measurements of light beam attenuation (beam-c) over stormflow events plotted versus field turbidity at three STEC sites in the Manawatu Catchment. Manawatu at TCOL – blue points and line; Tiraumea at NGA – brown points and line; Pohangina at MAIS – green points and line. The relationships are closer for the tributary sites, where suspended sediment may be relatively homogeneous, than for the main-stem Teachers College site (downstream) with mixed source contributions.
Visual clarity is the only suspended sediment metric for which thresholds, including ‘bottom lines’ (allowable minima protecting aquatic life) are defined in the National Policy Statement on Freshwater Management (the NPS-FM 2020). Thresholds for deposited fine sediment are also given in NPS-FM 2020). We expect that modelling within the TEST framework, calibrated with beam-c data from Manawatu stormflows, will permit us to assess response of visual clarity, as well as sediment load, to different erosion control scenarios.