- Home
- ...
- Smarter Targeting of Erosion Control (STEC)
- Smarter Targeting of Erosion Control (STEC) News
Policy-relevant stated preference estimates of national water quality values in New Zealand
Land-based erosion and sediment transfer are also huge environmental problems for New Zealand and are at the heart of the STEC programme. In addition to reducing land productivity, they also affect water quality. Fine sediments are the most common cause of contamination in New Zealand’s waterways. The impact of sediment load on turbidity and clarity of water bodies can be predicted using models developed by NIWA (Hicks et al., 2016; Hicks et al., 2019). Innovative policies are needed to reduce soil erosion and improve freshwater quality, requiring coordinated action by national, regional, and local governments and groups. The government needs robust tools to analyse trade-offs in water quality policy options. For example, section 32 of New Zealand’s Resource Management Act (1991) requires identifying and assessing the benefits and costs of environmental policies and rules. However, the value of improved water quality is not easy to calculate as water quality is not a market good. Economists have developed a range of non-market valuation methods to estimate these values. However, the New Zealand-specific estimates found in the existing literature are not well-suited to analysing national policy. To improve national policy analysis for water quality and erosion-related values, Manaaki Whenua - Landcare Research implemented a national stated preference survey supported in part by the STEC programme.
Choice experiment
We conducted a choice experiment survey of almost 2,000 households across regions of New Zealand to understand the preferences for water quality in streams and rivers. The choice experiment is a method where values or preferences are elicited using hypothetical questions. We asked respondents to choose between several options that included different changes in water quality and different costs to their households. The water quality was characterised by three attributes, including water clarity, nutrients concentration, and Escherichia coli. The levels of changes in the attributes were selected in a way that respondents could accurately perceive, are realistic, and could be directly linked to the policy-induced changes.
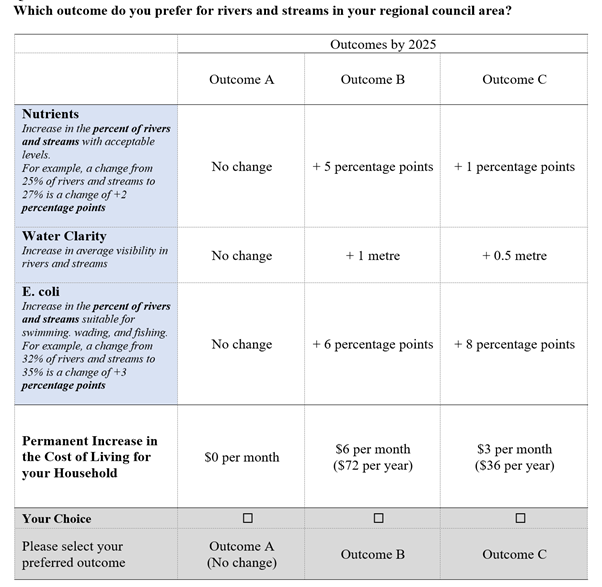
The survey instrument included a series of questions to gauge the participants’ perception of the consequentiality of their responses, socio-economic questions, and three choice questions. There were separate versions of the survey for the North Island and South Island of New Zealand that differed in the attribute levels. An example choice question from the survey appears in Figure 1. The respondents were asked to choose between an option with no changes in water quality attributes and no cost and one of two options with different improvements in three water quality attributes and a cost to the household.

Figure 1. Example of a choice set.
The survey was administered in 2019. Out of 2,007 respondents that took the survey, 1,769 answered at least one choice question. After removing the protest responses, responses with possible hypothetical bias, and the respondents who always chose the highest cost, the sample included 1,364 respondents representing all New Zealand regions.
The survey data were analysed using the random utility model (RUM) framework (McFadden, 1974). It assumes that a respondent makes a choice that maximises the utility to the household, where a utility of an option is a linear combination of utilities of the attributes. The RUM was estimated as mixed logit specifications to allow respondents’ heterogeneity of preferences (Greene, 2000; Haab and McConnell, 2002). The model includes interaction terms between the choice attributes and observed household-specific socio-economic variables, user-specific recreational variables, and baseline regional water quality characteristics. The region-specific values of Marginal Willingness to Pay (MWTP) were estimated using interaction terms and region-specific water quality parameters.
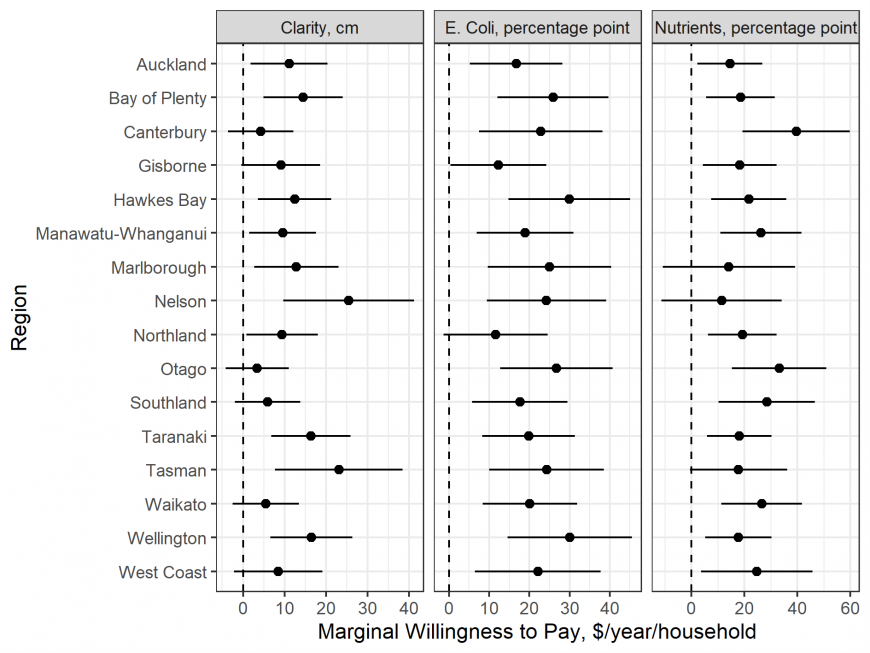
The MWTP estimates from the preferred model are presented in Figure 2. The first column shows the average household’s willingness to pay per year for a one-centimetre increase in average water clarity in a region. The whiskers show 90% confidence intervals. These values range from $7.8 to $27.3. The second and third columns depict the MWTP estimates for a percentage point increase in regional waterbodies meeting their E. coli and nutrients concentration criteria. The MWTP estimates for E. coli fall between $11.6 and $30.7, and the MWTP estimates for nutrients fall between $11.36 and $39.6. Overall, the results show that people are willing to pay positive amounts for improvements in water quality, with notable economically significant differences across regions.

Figure 2: Average MWTP values for each water quality parameter across regions.
Policy Illustration
We demonstrate how these values can be used in a policy setting by monetising the benefits of water quality improvements modelled by NIWA for the Ministry for the Environment (MFE) (Hicks et al., 2016; Hicks et al., 2019). Sediment was identified as a high priority contaminant for freshwater, as it can have significant implications for ecosystem health (NPS, 2020). Both in-stream sediment criteria and clarity criteria were formulated that would meet nationwide “bottom lines” in each of the four primary state variables. Neverman et al. (2019) used a combination of economic and environmental modelling to explore cost-effective ways to achieve the suspended sediment criteria.
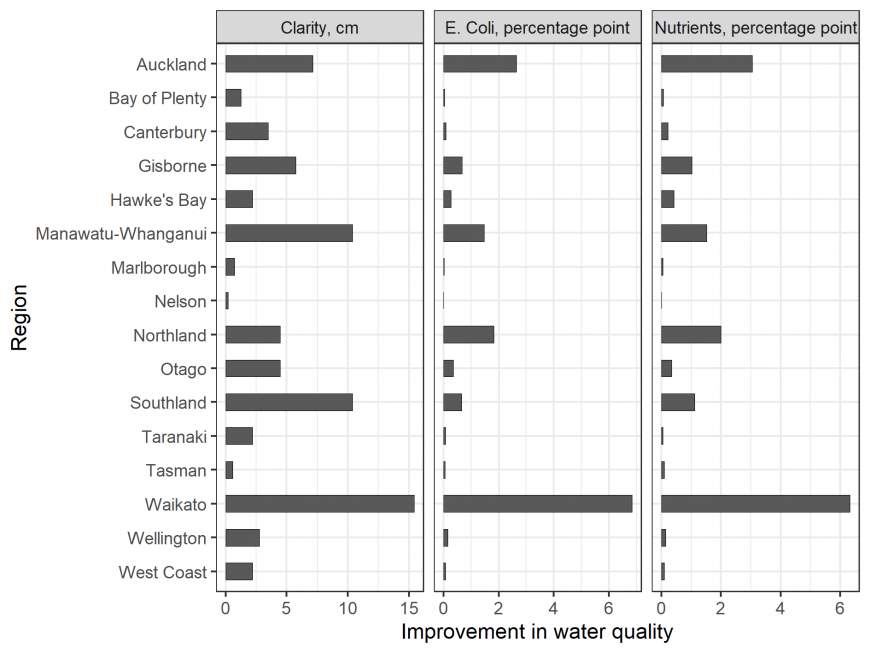
This study focuses on a hypothetical policy that would meet all the clarity criteria. It also estimates the subsequent impacts on E. coli and nutrients using data from Stats NZ (2020). The changes in all three water quality parameters for each region appear in Figure 3.

Figure 3: Projected mean water quality improvement by region resulting from meeting water clarity requirements.
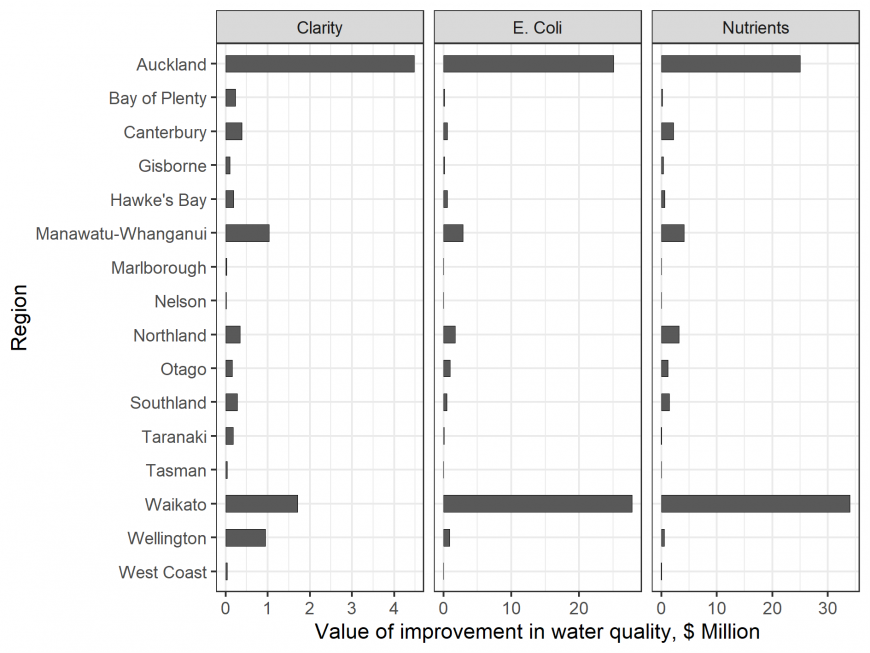
We use a benefit function transfer to apply the estimated WTP values to the changes in water quality while controlling for regional council baseline water quality, the total length of rivers, and sociodemographic characteristics. The region-level estimates of the value of the improvements in water quality are presented in Figure 4. These values are the annual benefits of the fully implemented policy. The highest benefits of improvement in clarity, E. coli and nutrients are observed in Waikato and Auckland regions. The estimated annual benefits at the national level are $144 million.

Figure 4. Regional Council-level annual benefits of improvement in clarity, E. coli, and nutrients due to meeting water clarity requirements.
Conclusion
Evaluation, prioritisation, and planning of policies to reduce soil erosion require information about the benefits of these policies. This study estimates region-level marginal willingness to pay for three water quality parameters and demonstrates a method for valuing water quality benefits associated with reduced soil erosion. These values can be used to evaluate soil erosion reduction policies in coordination with other benefit and cost estimates, such as agricultural productivity benefits and the impact of erosion on property damage.
For further information, see: Walsh PJ, Guignet D, and Booth P 2022. National Water Quality Values in New Zealand: Policy-Relevant Stated Preference Estimates, NCEE Working Paper Series, US Environmental Protection Agency, Washington DC.
References
Greene WH 2000. Econometric Analysis, 4th Edition ed. Prentice Hall, Saddle River, New Jersey.
Haab TC, McConnell KE 2002. Valuing Environmental and Natural Resources--The Econometrics of Non-Market Valuation. Edward Elgar Publishers, Northampton, MA.
Hicks M, Greenwood M, Clapcott J, Davies-Colley RJ, Dymond JR, Hughes A, Shankar U, Walter K 2016. Sediment Attributes Stage 1, Report Prepared for the Ministry for the Environment, in: National Institute of Water & Atmospheric Research (Ed.), Christchurch, NZ.
Hicks M, Semadeni-Davies A, Haddadchi A, Shankar U, Plew D 2019. Updated sediment load estimator for New Zealand, MFE18502. National Institute of Water & Atmospheric Research Ltd, Christchurch, NZ.
Hughey K, Kerr G, Cullen R 2016. Public Perceptions of New Zealand's Environment: 2016. Lincoln University, Lincoln.
McFadden D 1974. Conditional Logit Analysis of Qualitative Choice Behavior, in: Zarembka, P. (Ed.), Frontiers in Econometrics. Academic Press, pp. 105-142.
MFE and Stats NZ 2019. New Zealand’s Environmental Reporting Series: Environment Aotearoa 2019., in: Wellington (Ed.), Available from www.mfe.govt.nz and www.stats.govt.nz.
Neverman A, Djanibekov U, Soliman T, Walsh P, Spiekermann R, Basher L 2019. Impact testing of a proposed suspended sediment attribute: identifying erosion and sediment control mitigations to meet proposed sediment attribute bottom lines and the costs and benefits of those mitigations, in: Ministry for the Environment (Ed.), Wellington, NZ.
NPS 2020 National Policy Statement for Freshwater Management New Zealand Government.
StatsNZ 2020. River water quality: Escherichia coli.
