In the MBIE STEC research programme, one work stream focuses on identifying better methods for monetising the benefits and costs of erosion control. This article discusses one of the methods currently under development, which links erosion and landslides to insurance claims from the Earthquake Commission (EQC). Erosion and landslides cause significant damage to properties and infrastructure in New Zealand and several studies have attempted to quantify aggregate impacts to an area. These studies combine impacts from multiple sources, such as flooding and landslides. While this type of approach is useful for characterising the magnitude of the problem, it is less useful in identifying the sources of those damages. For example, it is important to know that a storm caused $5 million in damages, but it is more difficult to identify how much of the $5 million is due to erosion. This research programme aims to better estimate that relationship.
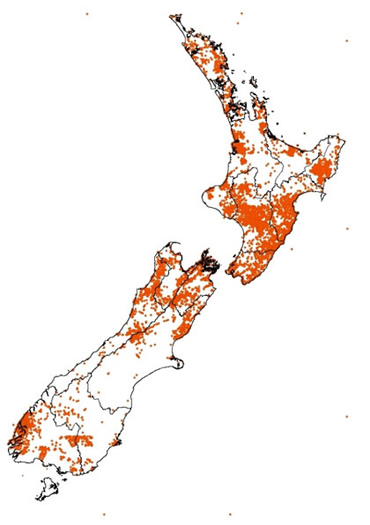
Figure 1. GNS Landslide Database
We start with a database of 86,653 claims from the EQC, who provide partial insurance to residential properties for damage related to landslides, storms, and floods. Although it can be difficult to differentiate between damage from landslides, storms, and floods, EQC only protects the land (but not buildings) from flooding but protects both land and buildings from storm and landslide damage. Claims with building damage are therefore much more likely to be associated with the latter, so are analysed here.
To identify landslide sites, we use data from the GNS Landslide Database.[1] Figure 1 contains a map of locations from that database, with landslide locations in orange.
To visualise the spatial incidence of landslides in relation to EQC claims, Figure 2 uses standard deviational ellipses to represent the distribution of landslides (blue), EQC claims (pink), and EQC building claims (red).[1] In most cases, the building claims ellipses are close in size to the ellipses representing the full set of EQC claims (building plus land claims). The map also shows that some regions have a similar size and shape of the EQC ellipses and the landslide ellipses, like the Manawatu–Wanganui region and the Auckland Region. Conversely, in other regions where cities are closer to the coast, such as Canterbury or Nelson, there is less overlap between the landslide ellipse and the EQC ellipses. In those areas, there are fewer residential properties near landslide- and erosion-prone land.
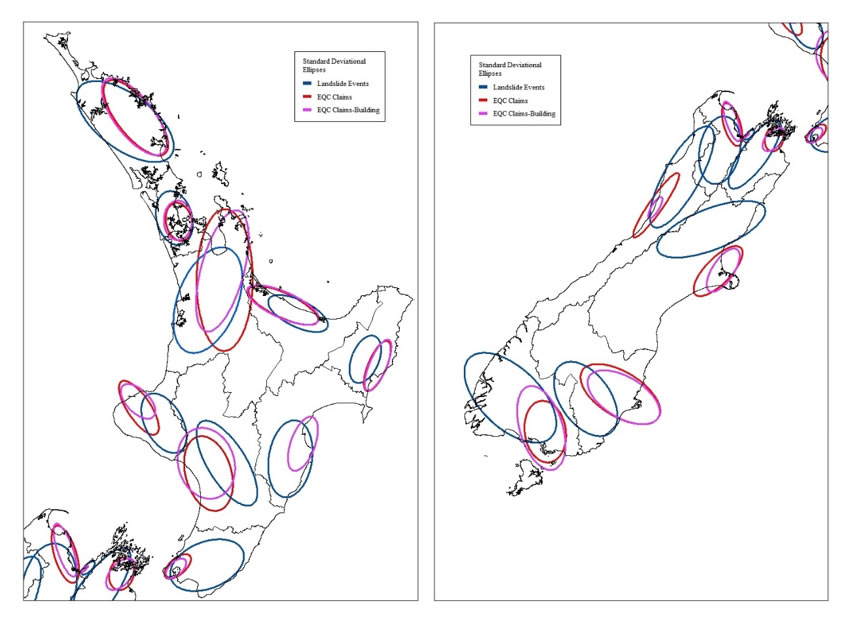
Figure 2. EQC claims and landslide standard deviational ellipses
Bringing this all together, Figure 3 shows some initial results from statistical models that estimate the impact of erosion and landslides on EQC claims (while controlling for many other factors) at the Census meshblock level. The dark green line in the figure shows the marginal impact of an additional tonne of erosion on EQC claims, with the light green area representing the 90% confidence interval. The effect is evaluated at different landslide incidences along the x-axis, where landslides per hectare were grouped into four quartiles, with 4 being the highest and 0 indicating no landslides. In an area without landslides (0 on the x-axis), erosion does not have a statistically significant effect on EQC claims. The same is true in the first and second quartiles of landslides. However, in the third and fourth groups, with the highest incidence of landslides per hectare, an increase in average meshblock-wide erosion of one tonne is associated with a $50 to $220 increase in EQC building claims paid. Although this is only an initial rough estimate, it is probably an underestimate since we only look at building claims.
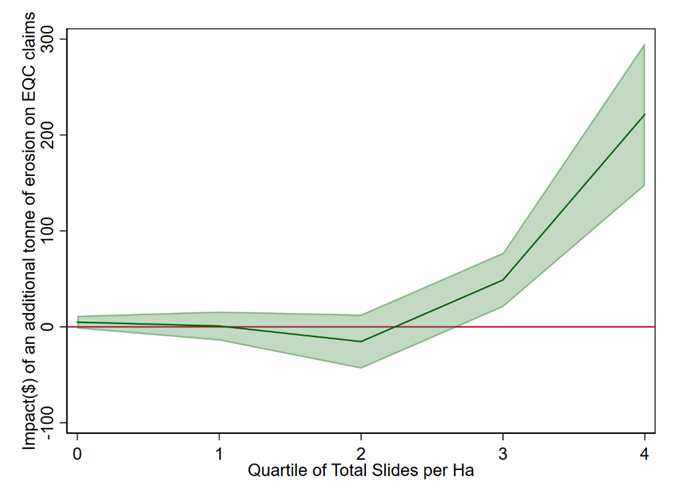
Figure 3. EQC claims, erosion, and landslides
[1] http://data.gns.cri.nz/landslides/index.html. Unfortunately the database does not contain landslide extent maps, only point locations and a classification of large, moderate, and small.
[2] For additional information about these ellipses, see http://resources.esri.com/help/9.3/arcgisengine/java/gp_toolref/spatial_statistics_tools/how_directional_distribution_colon_standard_deviational_ellipse_spatial_statistics_works.htm