In order to better understand how different sources of sediment affect water quality, we have established a dedicated erosion and sediment research catchment in the headwaters of the Tiraumea (a tributary of the Manawatu River), known as the Haunui research catchment. The catchment covers c. 18 km2 and contains a range of erosion processes and sediment sources within close proximity of the catchment outlet.
The research catchment brings together multiple complementary techniques and technologies to better understand how changes in the contributions of sediment from different erosion sources under a range of flow conditions (i.e. low summer flows versus storm flows) affects instream turbidity, suspended sediment concentrations, and loads.
Sediment Sources
To understand where sediment is coming from, we are utilising a technique known as sediment fingerprinting to distinguish sediment based on its geochemical properties (fingerprint). We have collected 70 samples from potential sediment sources and analysed them to obtain their geochemical fingerprints (Figure 1). This allows us to sample sediment from within the stream and link it back to a source, based on a statistical analysis of the geochemical properties of the sources and instream sediments. We plan to take sediment samples from the stream during a range of flow conditions (Figure 2) to capture the relationship between sediment source and contribution to stream sediment.
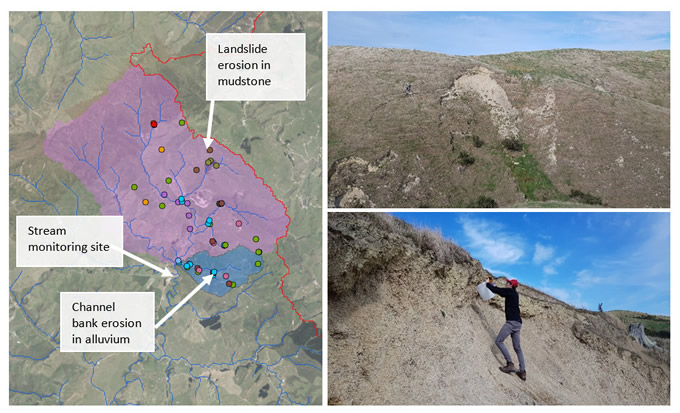
Figure 1. Haunui research catchment in the upper Tiraumea showing source sample locations left and sampling of landslide erosion in hill country right
Monitoring
To better link erosion processes with changes in turbidity and suspended sediment at the catchment outlet, we have established continuously operating sensors to record meteorological and stream flow data. Continuous GNSS (Global Navigation Satellite System) receivers have been installed on the earthflows to obtain sub-daily movement rates to better understand when the earthflows are active and contributing sediment to the stream network, which can help link earthflow movement to meteorological conditions.
We have also established a network of monitoring pegs on earthflows for repeat surveying to measure earthflow movement rates. We have completed our first 12 months of monitoring peg surveys and have recorded movement rates ranging from 0 to 8.5 m over this period (Figure 3).
These surveys are supplemented by structure-from-motion drone surveys to reconstruct the morphology of the earthflows and calculate erosion/deposition volumes to understand how much material is eroded from each earthflow.
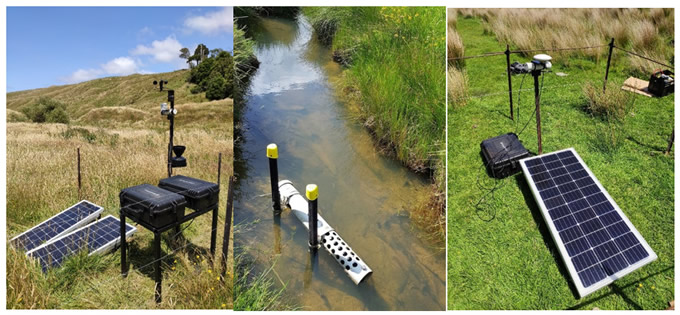
Figure 2. From left to right a weather station a sonde measuring flow and turbidity. A GNSS system monitoring earthflow movement
Dashboard
The sensors in the catchment have a 3G mobile network connection and send data to a database at intervals ranging from 10 minutes to 1 hour. The database is viewable via a dashboard (Figure 4) accessed through a web browser. This enables us to see what is happening in the catchment in near real time so that we can see if sensors have stopped working, or if there is a high flow event so that we can go to the site to collect samples.
Figure 4 shows example plots from the dashboard for turbidity and rainfall, where three rainfall events resulted in turbidity peaks. Further work is needed to collect water samples and calibrate turbidity data with measurements of suspended sediment concentration from these samples to use in estimating suspended sediment loads.
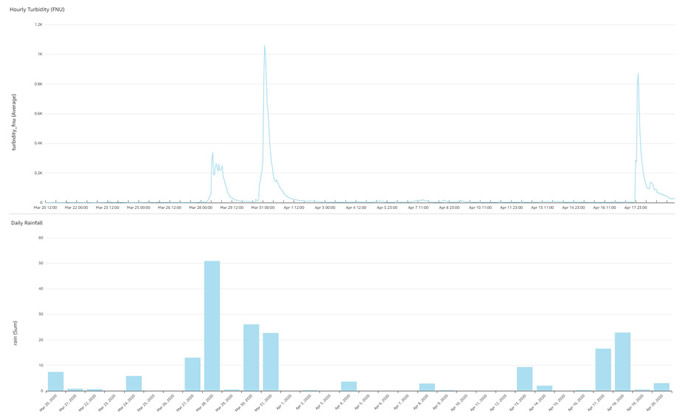
Figure 4. Example plots from the telemetry dashboard showing turbidity and rainfall data.
Key contact