As farmers are challenged to meet increasing demands to transform their operations into climate-smart landscapes, decarbonise their operations and supply chains, and be financially sustainable, ‘Smart Farming’ allows farmers to adopt that F1 mindset.
Farmers need to optimise technology in the farm management cycle to be their most productive.
However, the cycle starts at the most basic level with the soil. A farmer needs to know the condition of the soil before the capacity or capability of it can be improved.

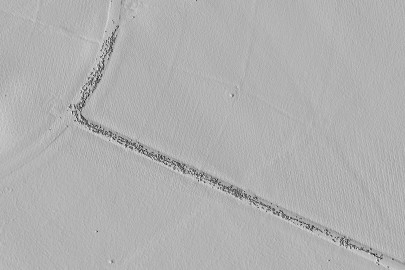
LIDAR image showing detailed ground elevation and cattle on a farm track
On the highly productive, but stony, Canterbury Plains, for example, dairy farmers need to improve intensive irrigation to mitigate nitrate leaching that degrades water amenities. To do this requires knowing the available water capacity, which means collecting data on the minimum (permanent wilting point) and maximum (field capacity) amount of water the soil can hold.
A farmer also needs to know how much fertiliser to add and the lime requirement to neutralise acidity. All this requires costly, and labour intensive, soil sampling. But what if you could make this analysis more cost effective by reducing the number of sample points and still be confident in the accuracy of the data?
At the Lincoln Dairy Farm, our scientists are demonstrating it is possible to acquire digital data from a smaller number of soil condition data points.
During a trial across the 160-hectare Lincoln University Dairy Farm we started with 160 sampling points to create accurate, digital soil maps showing water capacity.
Then we introduced data from remote (i.e., LiDAR) and proximal sensors (e.g., electromagnetic (EM) and gamma-ray) to make higher resolution digital soil maps. Researchers demonstrated they were able to significantly drop the number of soil samples required, while still producing accurate maps.
LiDAR was able to create models of ground elevation and show features such as small depressions that can indicate the location of stony soils. Similarly, EM and gamma-ray data identified the location of more conductive clay soil.
Preliminary results indicate that to make digital soil maps of biological (carbon and nitrogen), chemical (exchangeable calcium and magnesium), and water conditions, as few as 10 to 20 soil samples are needed. A huge cost saving for farmers who can then use the data to drive decision-making based on the soil’s capacity to increase carbon, build structural resilience and store water.
Moreover, it opens the potential to make it affordable to monitor a range of other digital information on soil water (using moisture probes), climate (installing weather stations), yield (satellites) and even from collars on cows. Being able to run simulations from all this data, such as tracking individual cows all the way home to work out where they have been and what they have been grazing, will allow farmers to make better decisions about how to irrigate and where to fertilise. Using digital data to map soils could potentially reduce sampling costs by 80%, which will definitely put farmers in pole position.
