More S-map support for farm-scale soil information
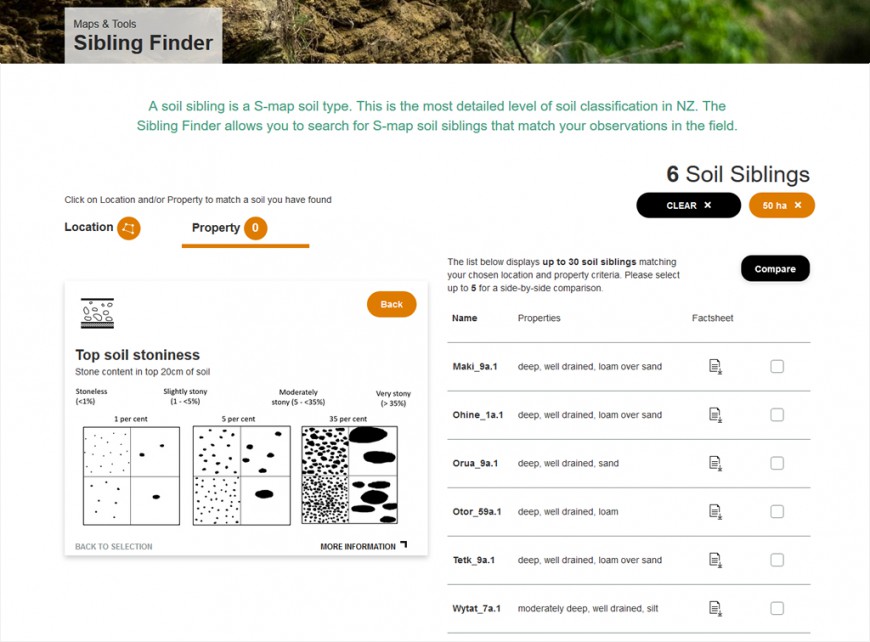
S-map data vary in scale but are at least 1:50,000 or finer resolution. While suitable for regional or catchment scale modelling or analysis, at the farm scale S-map can at best indicate the soil types likely to be found, but maybe not their exact location. The Sibling Finder is designed to allow farm managers to search the S-map database for soil siblings in their area that match some observations they can easily make by digging a hole. For example, the manager can follow the instructions to determine the texture of the soil, stone content and depth, then compare all the S-map siblings in the locale that have the same characteristics. Once the most likely S-map sibling has been identified, the farm manager can then access all the soil properties for that sibling.

Figure 1: Snapshot of the new Sibling Finder tool on S-map Online
The second tool is the mapunit factsheet, which is built using web technologies that facilitate a more graphical and interactive style of factsheet. This allows users to quickly visualise the soil siblings at a location, making it easier to understand the differences between them, and thus identify the most relevant S-map sibling for different areas on their farm. Both these tools are part of the August 2020 update of S-map Online.
Figure 2: Plot on the new map unit factsheet allowing easy comparison of the soils in the soil map unit.
The third new development is the addition of a novel module within S-map that has been designed to capture soil-landscape relationships. The geomorphic context of new mapping, as well as the wealth of knowledge on soil landform relationships buried in old survey reports, can now be captured in the S-map information system. Pedologists can build ‘landform trees’ that explicitly describe their expert understanding of how the soil has developed in each area. The design and implementation of this new module is a significant step towards helping land managers interpret their land and downscale S-map to the farm scale. The landform tree will provide guidance as to the likely location of each soil, e.g. lower terrace, in the hollows, on the fans. The next step is to complete population of the landform trees and to put this new information onto S-map factsheets.
The fourth development is to use proximal sensing technology on farm-specific soil samples to provide a spectral scan of the sample that can then be converted into predictions of key soil properties using the S-map inference engine. We are currently testing and refining predictions for New Zealand soils, based on calibrating predictions against the physical samples of the National Soil Archive associated with the analytical laboratory data for sites in the National Soil Data Repository. The aim is to develop a national soil spectral library and predictive algorithms in the S-map inference engine. A pilot study has been demonstrated on four case study farms – with co-funding from Fertiliser Association of New Zealand, in collaboration with Ravensdown and Ballance. Through this pilot we developed a proof-of-concept workflow covering the feasibility of key steps from on-farm soil sampling through to the delivery of customised soil information to different end users.
These four developments are all designed to use the power of the National S-map soil information system to support consultants to provide relevant soil information to the farm manager.
Key contacts


