Since then, the Human Footprint Map has been revised and upgraded several times, increasing its capacity to map global threats to biodiversity and to assist with conservation planning and research. It has been used to understand losses of intact ecosystems, changes in species extinction risks, and to quantify the contribution of Indigenous lands with low human pressure to terrestrial mammal conservation.
However, the map resolution is quite coarse (minimum size 1 km2) and it also uses a map projection – the Mollweide projection – which is good for showing global patterns but distorts the appearance of mid-latitude countries such as New Zealand.
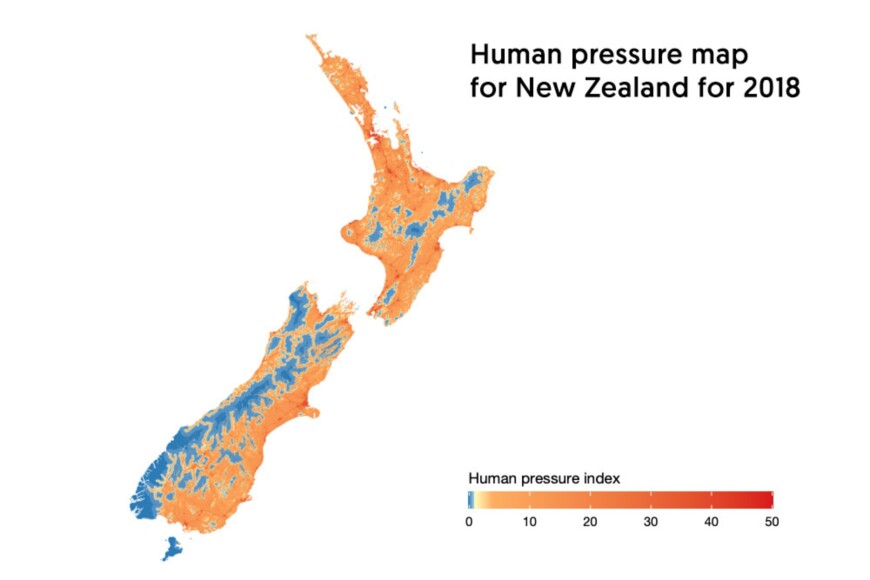
To make the map more useable in a national and regional New Zealand context, Dr Olivia Burge and Richard Law at Manaaki Whenua – Landcare Research, with Sandy Wakefield at the University of Canterbury, have added a new map layer to create a New Zealand human pressure index. The new layer is at higher resolution (100 m), which matches other national-scale datasets, and also uses the same map projection as official topographical maps. It includes eight components of human pressures: built environments, cropland, navigable waterways, pasture, population density, rail, roads, and visible night lights, comparing data for 2012 and 2018.

Map: Human pressure index 2018.
The local layer revealed that 28% of New Zealand’s terrestrial area can be classified as “wilderness” while 60% is “highly modified” by human pressures. This is consistent with the global wilderness estimate of 28% in 2018, although much wilderness elsewhere is tundra and boreal forests/taiga, neither of which is found in New Zealand. By contrast, temperate broadleaf and mixed forests dominate New Zealand’s wilderness areas, which also have more montane grasslands and shrublands, temperate grasslands, savannahs, and shrublands than the global average. Total human pressures on the environment between 2012 and 2018 remained much the same, following the pattern shown by other higher-income countries.
To test the usefulness of the new human pressure layer to support conservation-based land-use planning, the researchers then investigated specifically whether it could explain or predict the survival of freshwater wetlands in New Zealand. Wetland conservation and loss are critical in the face of the increasing frequency of extreme climate events and the services wetlands provide in terms of flood mitigation.
Between 2012 and 2018, 1,681 ha of wetlands were lost nationwide. The mapping showed that the biggest pressure on all wetlands was proximity to roads, but the better resolution of the new human pressure map layer enabled the researchers to see that the lost wetlands were additionally within 100 m of land recently converted to pasture. This is a useful finding, because it shows the power of the new layer, even given limited time-series data, to differentiate between pressures on the environment and to predict likely patterns of habitat disappearance if those pressures are not mitigated – both essential tools for effective conservation management.

