- Home
- ...
- Our science
- Safety
A prototype tool for calculating relative performance risk scores
In this section
Modern biocontrol testing usually produces unequivocal results making it easy to reliably determine if a candidate agent is safe or too risky to release. However, in laboratory conditions, candidate agents sometimes feed and develop on plant species that they would ignore in natural field conditions. This presents a dilemma: how can we reject risky agents without using an overly risk-averse approach that prevents the release of safe and potentially effective agents?
If a candidate agent performs poorly on a particular test plant it is considered an inferior host, compared to the target weed, indicating that the relative performance on test plants vs. the target plant, might predict field host use.
A database of host-range-test data was compiled for 23 agents already released in New Zealand where test plant species growing in New Zealand (both native and exotic) supported development in no-choice tests. Relative performance scores were then calculated for development (percentage survival on the test plant divided by percentage survival on the target weed) and reproduction (number of eggs laid on the test plant divided by the number of eggs laid on the target weed). These relative performance scores were then multiplied together to give combined risk scores.
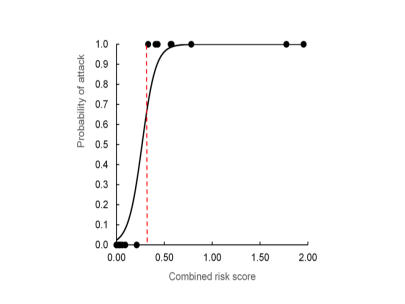
Field surveys were conducted to identify which of the laboratory test host plants were field hosts in New Zealand. A statistical analysis showed very strong correlation between combined risk score and field host use and there were no cases of host use below a combined risk score of 0.33 (Fig. 1), indicating that combined risk scores of 0.33 or more are risky, but lower scores may indicate low risk.
It is important to note that this risk assessment tool is part of a range of tools used to assess risk and that a bigger, international dataset is being compiled to assess its reliability.

Figure. 1 Cases of field use (probability of attack = 1) and no field use (probability of attack =0) (black dots) correlated with combined risk score (black line). Potential threshold between low-risk and high-risk scores = 0.33 (red dotted line).
Further reading
Paynter, Q., Fowler, S. V., Gourlay, A. H., Peterson, P. G., Smith, L. A., & Winks, C. J. (2015). Relative performance on test and target plants in laboratory tests predicts the risk of non-target attack in the field for arthropod weed biocontrol agents. Biological control, 80, 133-142
Paynter, Q., McGrath, Z., McGrannachan, C. M., Morton, S., & Robinson, D. E. (2024). Predicting the field host-range of Leptinotarsa undecimlineata: A candidate biocontrol agent for Solanum torvum in Vanuatu. Biological Control, 188, 105406
Data Diving Provides Pearls of Wisdom, What’s New issue 68
