The honey landscape model
In this section
-
Restoring ecosystems
- Plants, invertebrates, fungi & bacteria
- Honey landscape model
- Increasing wader abundance
- Kiwi Rescue
- Koekoeā Quest – Uncovering secrets of the long-tailed cuckoo
- Long-term Ecology Laboratory
- More Birds in the Bush
- Restoring wetland ecosystem functioning
- Te Kura Huna o Te Urewera (The Hidden Treasure of Te Urewera) documentary released
- Wetlands
The issue
The mānuka honey industry is booming – but how many hives can the landscape sustain?
Mānuka honey has quickly become New Zealand’s latest gold rush, and honey lovers across the globe can’t get enough of the ‘liquid gold’. But with at least 879,750 registered beehives across the country, twice as many as 15 years ago, the industry is working at a rate that both our flowering vegetation and honeybees can’t sustain.
Beef, sheep, and dairy farming all have set stocking rate models to measure the amount of food available on a farm compared with the amount of stock eating that food so the supply can be balanced, but there isn’t a stocking rate model for beekeepers.
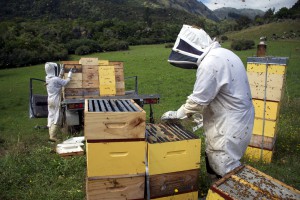
Without a stocking rate model, hundreds of hives can be placed on the same fence line as neighbouring properties, meaning bees are forced to compete for the mānuka vegetation in the area – resulting in overcrowding, disease spreading faster, more honey bees dying, and floral resources becoming exhausted.
Research indicates that about 10 per cent of the hives are lost each year, and this is partially due to overstocking – where too many hives are being placed on properties and bees basically don’t have enough food and don’t produce any honey or they consume all the honey in the hive to survive.
We can maximise the return from the number of hives, and the amount of honey you are getting out of each hive if we understand what the stocking rate should be.
The model
A large proportion of New Zealand’s natural mānuka populations grow on Māori-owned land and Māori agribusiness have teamed up with Manaaki Whenua – Landcare Research scientists, Plant and Food Research, and the University of Waikato, in a 5-year project that sets out to answer to learn more about mānuka DNA variation, beehive stocking rates, and honey bee food resources.
The Honey Landscape project aims to create a comprehensive model of New Zealand’s native honey landscape, blending science and tikanga Maori to maximise the opportunity presented by high-value mānuka honey production that helps landowners increase honey production while protecting the honey bees, native mānuka and plant species. The model will show in real time the nectar and pollen being produced in native forests and scrubland all over New Zealand.
The project has started with researchers and Māori landowners working together to collect leaf samples from natural mānuka stands all over New Zealand. These samples have been taken back to labs and the DNA is being extracted to discover how mānuka varies in genetic makeup across a landscape and region.
By the end of the programme, the aim is to have a tool that landowners can use to assess how many hives they can actually place in an area: they would take our tool, consider what is on the land, look at what sort of vegetation they have, and assess how many hives they’ve got or can actually run on the land without overpopulating the bees. The model will need to cope with New Zealands climatic variations, even if there are similar species in different parts of the country the amount of honey produced will vary.
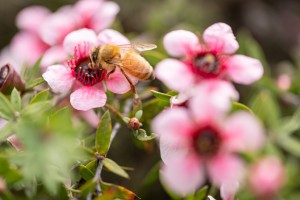
Mānuka honey is made by bees collecting the pollen and nectar from the mānuka flower, which is what gives the honey its unique non-peroxide activity properties and can only be produced in areas abundant with native mānuka blossoms. However, mānuka (Leptospermum scoparium) only blooms for 2–6 weeks per year. While mānuka honey-producing hives are placed on the edges of mānuka vegetation, honeybees will still collect pollen and nectar from other sources, so it is impossible to get 100 per cent pure mānuka honey out of a hive. To account for this, over the course of the project researchers will also collect and test samples from other common honeybee nectar and pollen resources, to have a deeper understanding of what’s being collected across an entire piece of land.
Case study
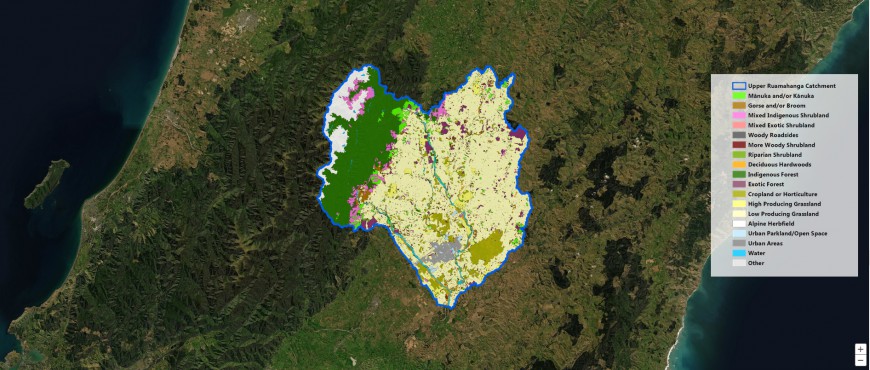
A case study has been completed in Wairarapa’s Upper Ruamahanga catchment to understand how to better manage hives in the area.

Spatial model for mapping the monthly nectar and pollen production, Upper Ruamahanga catchment, Wairarapa.
To assess floral resources for honeybees in the catchment, Manaaki Whenua – Landcare Research scientists have developed a spatial model for mapping the monthly nectar and pollen production. The maps created are based on estimated monthly production for various types of land cover in the area and identify the range of floral sources.
As a result, researchers can also estimate the monthly nectar and pollen supply for land cover in the catchment and how it can change over the year.Then, using the range of honeybee foraging distances, researchers can map the potential monthly supply of nectar and pollen resources to particular apiary locations within the landscape.
Beekeepers can then use these maps to gauge the best number of hives to place for the available resource at a particular time of year.
While this case study was only for the Upper Ruamahanga catchment, it is an example of the kind of research that will be incorporated into the Honey Landscape model to help beekeepers better manage their hive stocks during the year and across New Zealand.
Researchers aim to extend the current version of the Honey Landscape project model, testing it in different regions with the help of some of the project’s stakeholders.


