Real-time monitoring to detect erosion sources affecting sediment-related water quality
In order to better understand how different sources of sediment affect water quality, a dedicated erosion and sediment research catchment in the headwaters of the Tiraumea (a tributary of the Manawatu River), known as the Haunui research catchment, has been established under the MBIE-funded programme ‘Smarter Targeting of Erosion Control’ (STEC). The Haunui research catchment covers c. 18 km2 and contains a range of erosion processes and sediment sources in close proximity to the outlet monitoring site. This allows multiple complementary techniques and technologies to be brought together to understand how changes in sediment contributions from different erosion sources across varying flow conditions (i.e. low summer flows versus storm flows) affect instream suspended sediment concentrations (SSC), load, and related water quality attributes.
Sediment Sources
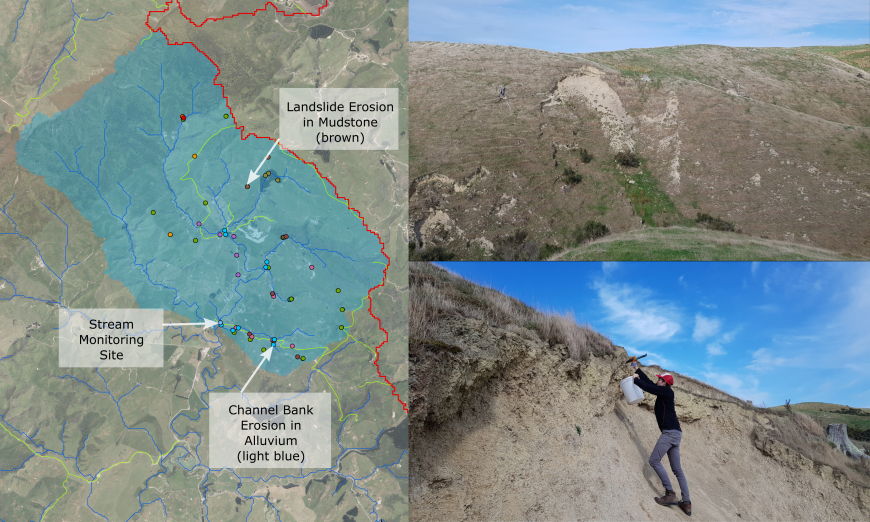
Sediment fingerprinting is being used to distinguish sediment sources based on geochemical properties (the ‘fingerprint’) that allow stream sediment to be linked to its erosion source and the determination of proportional contributions from these sources over varying flow conditions. So far, we have collected 70 samples from potential sediment sources, analysed them to obtain their geochemical fingerprints (Fig. 1), and are in the process of deploying auto-samplers to collect suspended sediment during storm flow conditions.

Figure 1. Haunui research catchment in the upper Tiraumea, showing source sample locations (left), and sampling of landslide erosion in hill country (right).
Monitoring
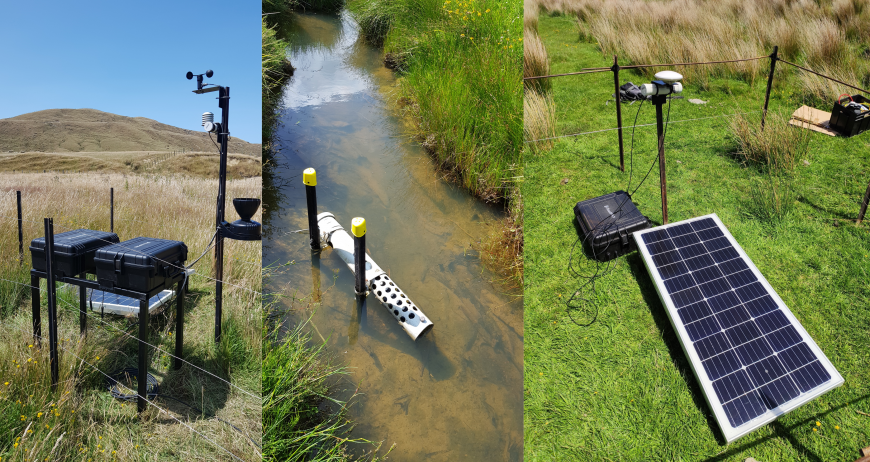
To understand the temporal link between erosion processes and downstream changes in suspended sediment concentrations (SSC) and loads more clearly, we have established a network of continuously operating sensors to record meteorological, stream flow, and turbidity data. The in-stream sensors are installed and telemetering turbidity and flow data that are currently being site calibrated to establish stage-discharge and turbidity-SSC relationships for a range of flow conditions (Fig. 2).

Figure 2. From left to right: a weather station; a sonde measuring flow and turbidity; a GNSS system monitoring earthflow movement.
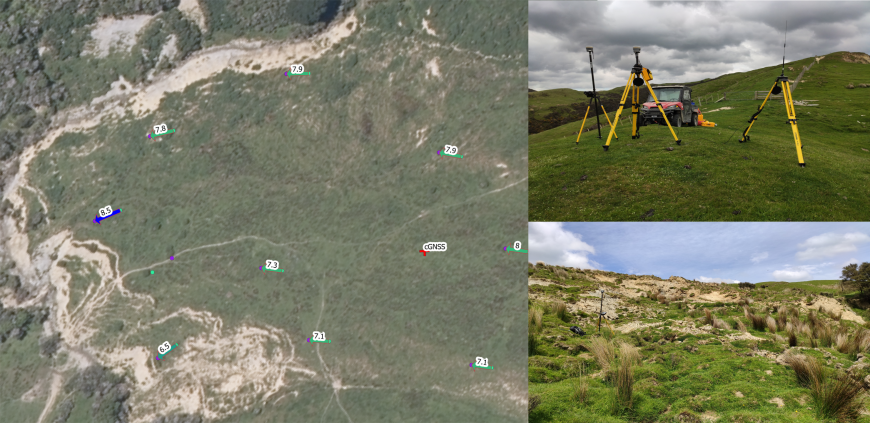
Continuous GNSS (Global Navigation Satellite System) receivers have been installed on earthflows to obtain sub-daily movement rates to better recognise when the earthflows are active and contributing sediment to the stream network. We have also installed a network of monitoring pegs on the earthflows for repeat surveying to measure spatial patterns in earthflow movement rates. We have completed our first 12 months of peg surveys and recorded movement rates ranging from 0 to 8.5 m over this period (Fig. 3). These surveys are supplemented by structure-from-motion photogrammetry surveys to reconstruct the morphology of the earthflows and calculate erosion/deposition volumes with repeat surveys to understand how much material is eroded from each earthflow.

Figure 3. Distance (in metres) that survey pegs moved over 12 months at the toe of one of the earthflows (left); Equipment set up for surveying earthflow movement (top right); toe of earthflow with a survey peg being surveyed (bottom right).
Dashboard
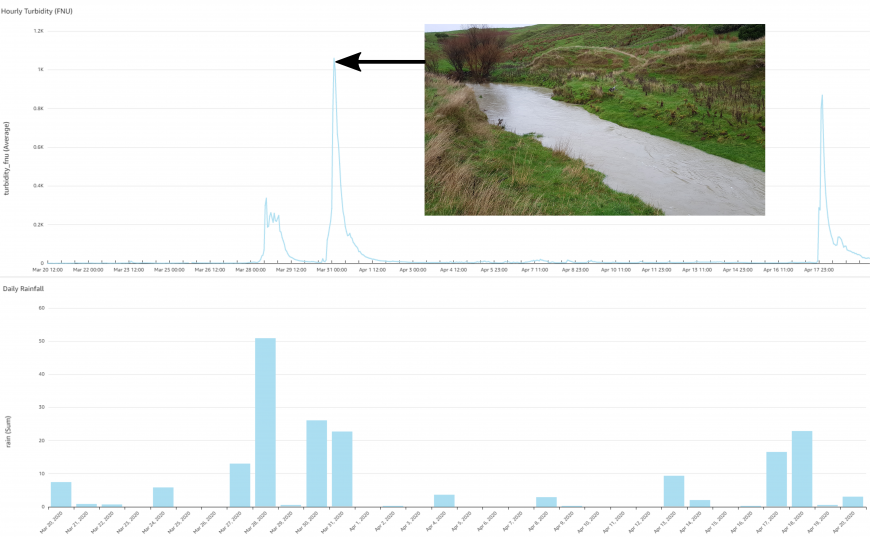
To enable near-real-time monitoring of the catchment, the sensors have a 3G mobile network connection and send data to databases at intervals ranging from 10 minutes to 1 hour. Flow and meteorological data are viewable via a dashboard (Fig. 4) accessed through a web browser. This enables us to see what is happening in the catchment to manage our sampling regime, and to help with sensor maintenance.

Figure 4. Example plots from the telemetry dashboard, showing turbidity and rainfall data with event peaks. Inset photo: stream during an event phase with high turbidity following rainfall (inset).
Monitoring will continue for a further 2-3 years under the STEC programme. The data will be used to improve our understanding of erosion processes, their links to freshwater quality attributes, as well as provide necessary data for modelling – another key part of the STEC programme.
Key contacts


