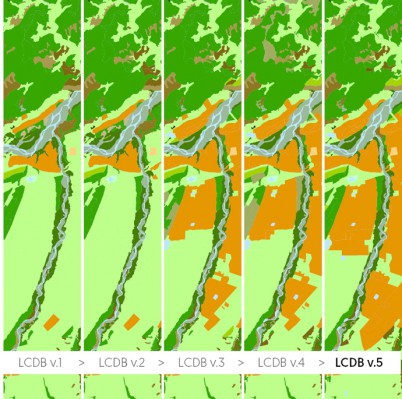
Progressive improvements in land-cover mapping have been made with each new version of the LCDB
Researchers say it is one of the biggest shifts in land cover since the first Land Cover Database, a digital map and multi-temporal, thematic classification of New Zealand’s land cover, was released nearly 20 years ago.
Land cover describes the extent of vegetation, built environments, water bodies, and bare natural surfaces across New Zealand. Measuring the composition of land cover and its changes is crucial to help decision-makers understand the pressures that different land uses are placing on our land and waterways, along with the implications for biodiversity and the functioning of ecosystems.
 “We estimate that three-quarters of the change we’ve seen since the 2012 version of the LCDB is due to the forestry cycle of harvesting and replanting,” says Programme Leader Peter Newsome. “But within that there’s over a hundred thousand hectares of true land-use change going on around wetlands, scrub being cleared, and dairy land-use intensification. And that’s quite a lot.”
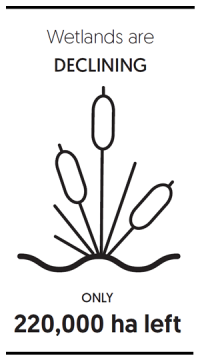
One changing land cover concern is the ongoing decline in wetlands. Preliminary results show that wetlands – New Zealand’s most depleted and threatened ecosystem – have continued to reduce over the past six years, with only 220,000 hectares remaining.
“Records from LCDB v5.0 show a steady decline in wetlands from drainage and conversion to pasture, with 1,660 hectares declining from a combination of 230 wetlands in the period 2013–18,” explains Newsome.
Other preliminary results show growth in the country’s built-up area appears to be at a rate of one to three thousand hectares per year, of which 65–75% is from high-producing pastural land and 8–10% from cropland, orcharding and other land covers.
“It also shows indigenous forest is being cleared at a similar rate to previous years; scrublands extent is reducing by two to three thousand hectares per year, with almost all the land being converted to exotic pasture; and pastoral intensification – as indicated by the spread of High-producing Exotic Grassland – may have peaked, with growth in this last interval, 2013–18, just 10,000 hectares,” adds Newsome.
There have been four previous versions of New Zealand’s LCDB, showcasing the changes in our land cover across 33 classes of land. The LCDB is used for a surprising number of applications, from international and national reporting of the state of the environment, through to the production of better maps, and management and monitoring of land cover and land use. For example, it has been used to monitor changes in catchments, and to decide the amount of bait needed in an area of land for predator control.
The fifth version of the database, which includes land-use data up to December 2018, was released by Manaaki Whenua researchers in early 2020.
