S-map is extensively used, with over 33,000 soil information sheets downloaded over the last year from the S-map Online website. It is used by rural consultants, councils, landowners, and others for crop/pasture management, nutrient budgeting, erosion control, irrigation management, drought resilience, and land valuation.

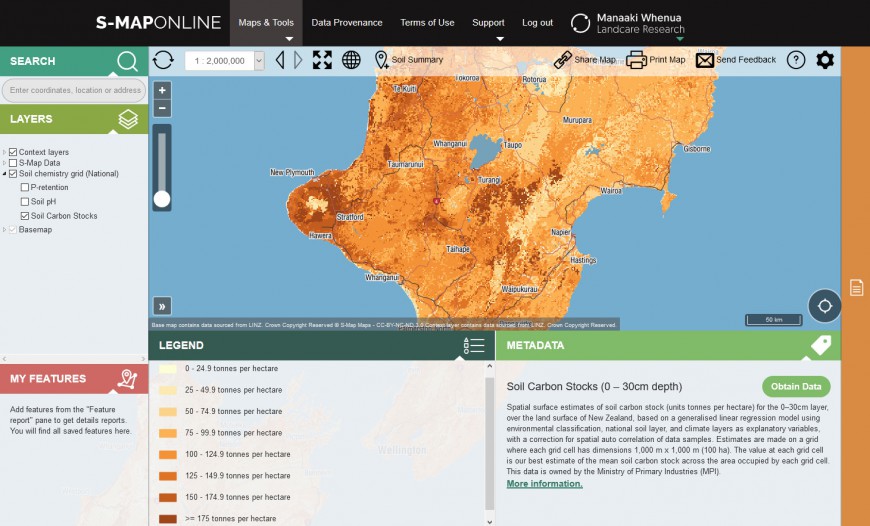
S-map Online: predicted soil carbon stocks in the middle North Island.
Although other, more spatially complete sources of soil information exist (for example, the New Zealand Land Resource Inventory, Fundamental Soils Layer), S-map operates at a higher resolution (a minimum of 1:50,000), combines on-the-ground soil sampling with digital mapping technologies, and incorporates a wider range of soil properties. This makes S-map a more accurate input for environmental modelling, farm environment planning and on-farm decision-support tools.
Among its many applications, S-map supports OverseerFM, an online software platform that enables farmers, including dairy, livestock, fruit, viticulture, and arable/vegetable farmers, to model and report on their on-farm nutrient balances, greenhouse gas emissions and carbon sequestration. Some 11,000 farms across New Zealand are users of Overseer.
In August 2020 S-map had a significant nationwide update, especially to its soil hydrology information, as part of an MBIE-funded Endeavour science programme running from 2016 to 2021, which has focused on the science that underpins S-map to enable continual improvement in soil information.
Dr Linda Lilburne, who co-leads the programme, says that there are many benefits to the new update. ‘Much richer soils data mean much better modelling assumptions, which in turn support better decision-making. More accurate soil moisture information will lead to better knowledge of irrigation demand and nutrient losses.’
The main changes to S-map, which users are now seeing online, are:
- increased coverage of New Zealand. With an additional 5,000 km2 of soil data, S-map now covers36.6% of New Zealand, including 67.3% of our ‘multiple use land’.
- a new model for estimating soil hydrological properties (including available water), based on a vastly increased amount of background laboratory data. The number of samples in the model is up from 1339 (over 313 sites) to 4641 (over 684 sites).
- three new national maps of soil chemistry attributes (carbon, pH, P retention).
- two new tools that help land managers and consultants find the S-map soil type that best matches on-farm field observations.
In a major new funding boost for S-map, in early December 2020 the government committed $6.25 million for a nation-wide project to expand S-map, with funding allocated by MPI under the Budget2019 Productive and Sustainable Land Use initiative.
This new investment is enabling significant co-investment partnerships with regional councils, and is ‘a real step-change in understanding the unique soil types and spatial variation in one of New Zealand’s key strategic natural assets’, says Dr Gerard Grealish, who leads the S-map soil mapping programme at Manaaki Whenua. In this first year of the programme, Gerard’s team has active soil mapping in Waikato, Bay of Plenty, Hawke’s Bay, Horizons, Wellington, Tasman, Marlborough and Canterbury regions. The aim, says Gerard, is to continue working with MPI and councils over the next 5 years to add approximately 1.5 million hectares of land to S-map.
Key contacts


