Researchers from Manaaki Whenua – Landcare Research have developed a downloadable mapping package using Geographical Information Systems (GIS) software. The software contains a collection of publicly available mapping data to allow users to visualise and to track the success of conservation efforts for specific species such as kiwi. The software can show where specific species live, the changing environment and sub-species distributions across a large landscape or region, or at an iwi-specific scale.
“It is a basic one-stop-shop package for conservation groups, landowners, and all communities, but in particular kaitiaki, to be able to start capturing iwi-specific matāuranga information,” says Manaaki Whenua Kairangahau Lead Researcher Kiri Reihana.
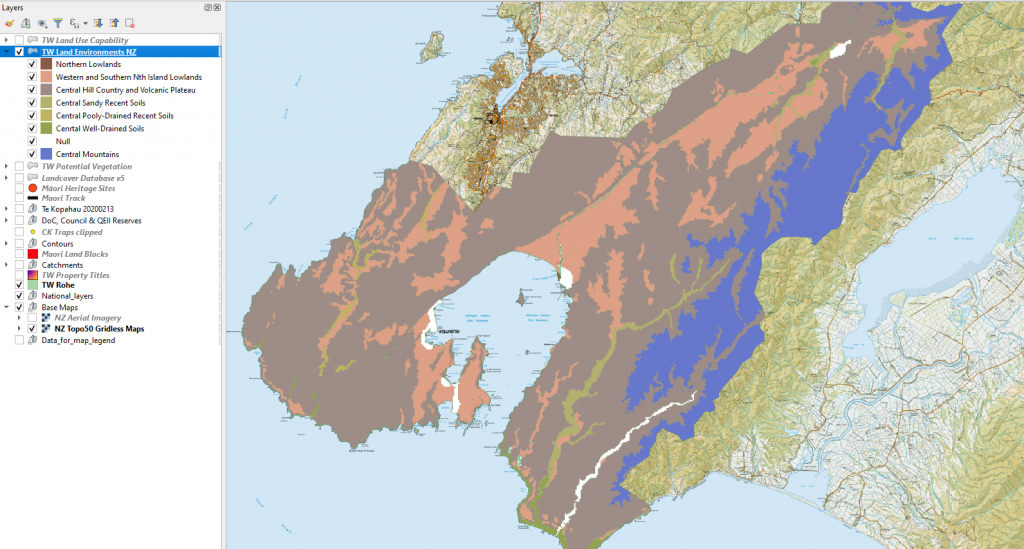
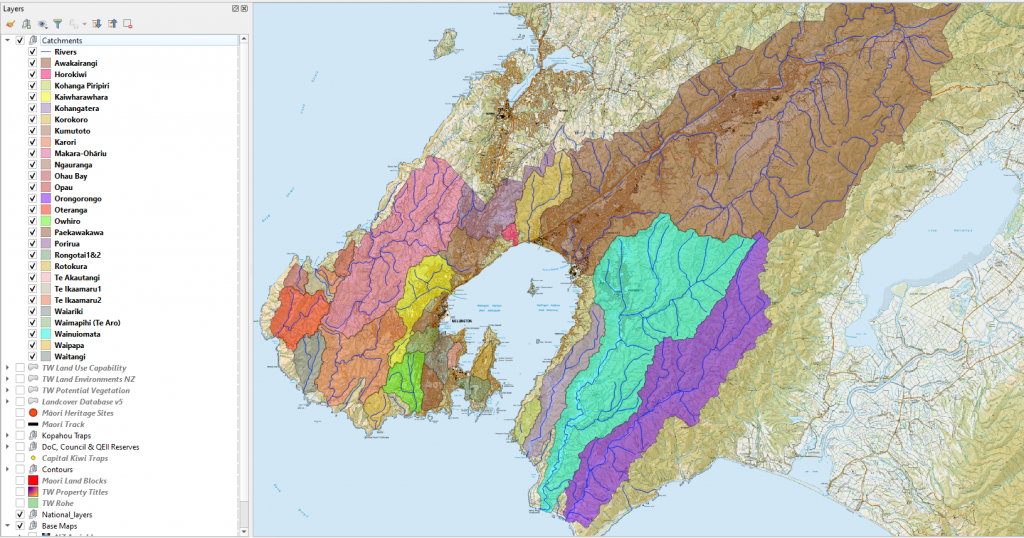
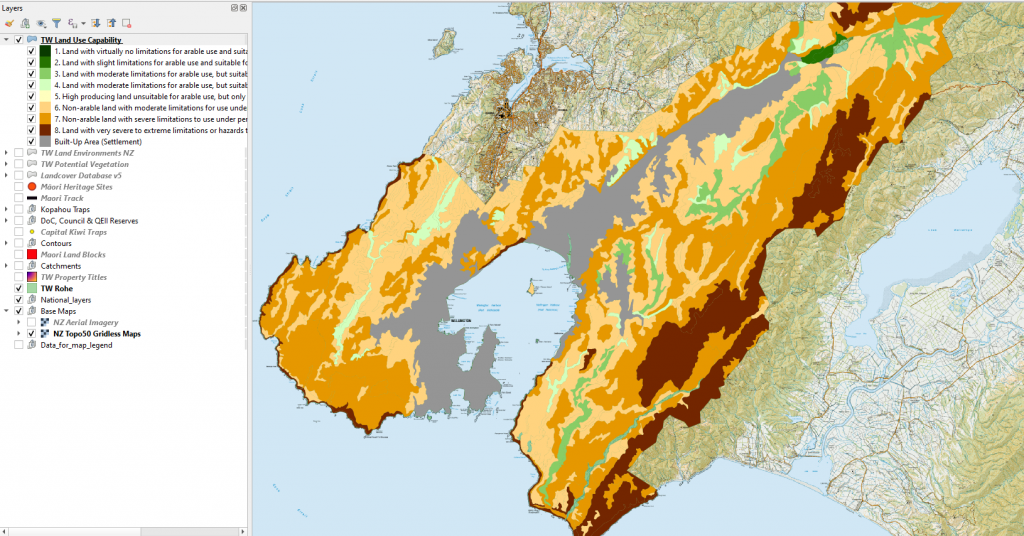
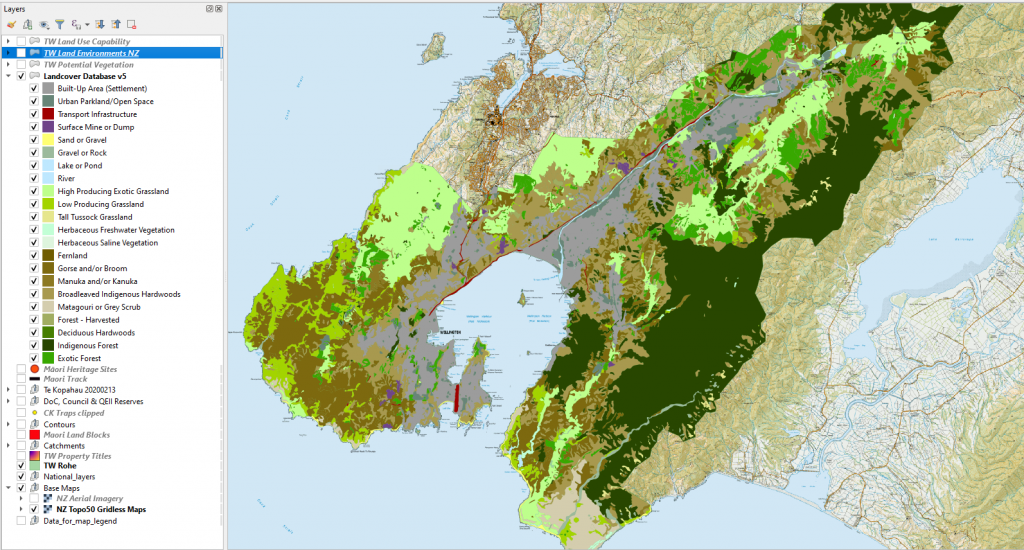
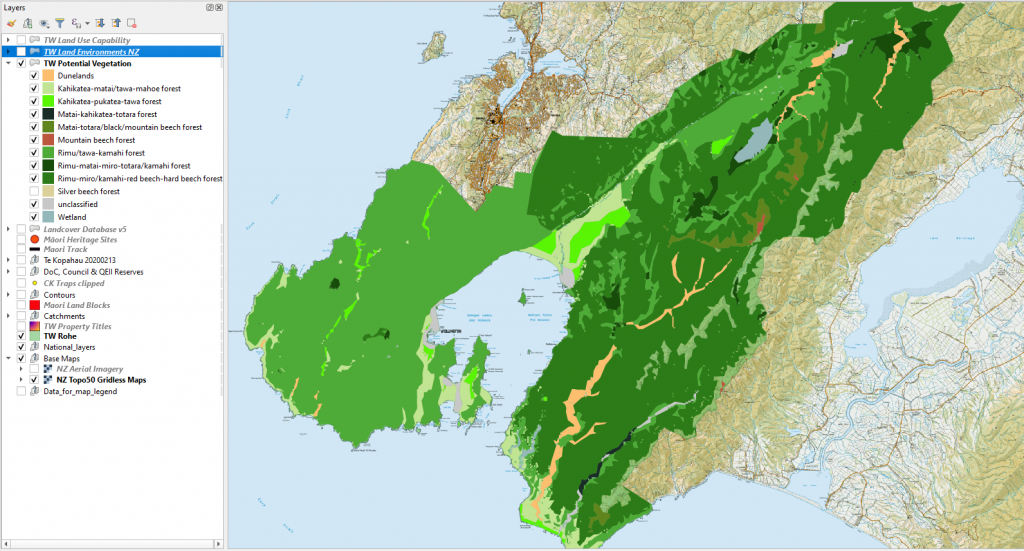
Below are examples of the types of maps that can be generated using GIS software. The example focuses on the iwi, Taranaki Whānui ki te Upoko o te Ika.
Case study: Kiwis for Kiwi
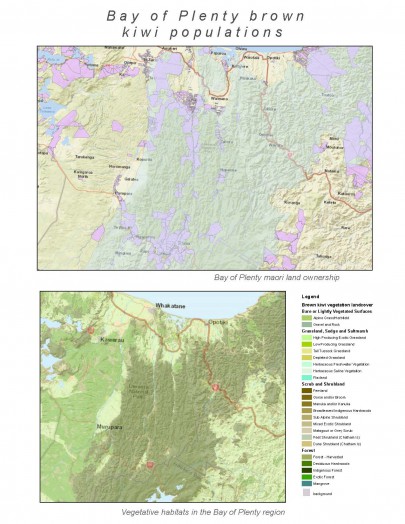
The project is the first of its kind and was created by Manaaki Whenua in conjunction with the national kiwi protection organisation “Kiwis for Kiwi” as a direct response to feedback from conservation groups asking for a low-level introduction to geospatial visualisation tools for monitoring and planning conservation progress.
“With the package, users can access all basic GIS maps in one place and look at geospatial layers of landcover, vegetation, rivers and other information at a specific scale. They can visually track their conservation efforts, see environmental or species changes, and map out where they should focus future endeavours to achieve conservation goals,” explains Reihana.
“We mapped kiwi as an example and accessed the pre-human species distribution data for the species in a particular region, compared this with current distribution data for that region then tracked landcover and environmental changes, and assessed where to focus future efforts,” she adds.
How to access the Basic GIS Visualisation package
The Basic GIS Visualisation package, which includes a ‘how-to guide’ GIS manual and collection of basic Shapefiles, is freely downloadable using the link below.
The files can be used with the free open-source software QGIS (see Section 3 of the accompanying manual) or with other GIS software, as well as on Google Maps.
Download the GIS Visualisation package