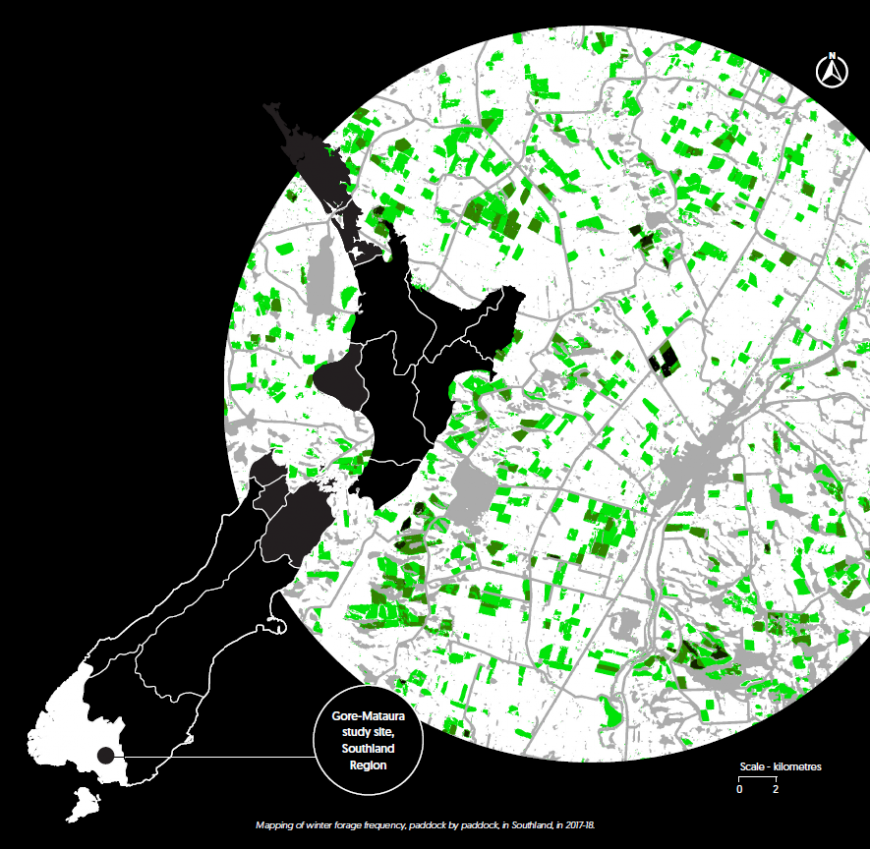
As an example, winter grazing of forage crops is a key land-use practice in southern New Zealand, providing important feed for livestock. In recent national research, Manaaki Whenua’s scientists identified Southland as the region with the most winter- forage cropping in hill country, as a percentage of all hill-country agricultural land. This practice has been identified as risky if not managed well, especially on slopes of 7 degrees or more, potentially resulting in soil degradation and nutrient losses. However, the extent of repeat cropping of winter-grazed forage crops is a knowledge gap.
In new research, we used an existing time series of winter-forage maps, derived from satellite imagery, to identify how often paddocks are re-used for winter forage. The work built on a series of evaluations for Environment Southland Regional Council and a nationwide exercise for MfE to assess the potential impacts and policy implications of the 2016 Southland Water and Land Plan. Principal funding was provided by MBIE under the Advanced Remote Sensing Aotearoa programme.

Mapping of winter forage frequency, paddock by paddock, in Southland, in 2017-18.
We examined maps derived from satellite images of the Gore-Mataura area, Southland, for the winters of 2013, 2014, 2017, and 2018. Within the 32 km × 32 km study site (67,618 ha), 8,925 ha were classed with high certainty as winter forage in one or more of the source maps. These winter-forage crops were generally grown on well- drained Brown soils (63%), followed by Pallic and Gley soils.
Although the study was limited by its pilot scale and by differences in mapping methods of the source maps, valuable data were derived. Only 15% of the total forage area was used in more than 1 of the 4 years mapped, and just 1% was used in 3 or 4 of the years. In terms of consecutive use, 21% of the forage crop area in 2017 was also used in 2018. This new knowledge will be useful when designing and developing best management practices across different soil types, and for regional policymaking.
If regular whole-region or nationwide land use mapping is undertaken in the future, the multi-year analysis method we have demonstrated could be applied widely for monitoring. It will also be valuable to investigate whether management practices such as strategic grazing and catch-cropping are detectable in time-series satellite imagery.

