S-map goes from strength to strength
An additional 1.98 million hectares have been added to S-map in the past 5 years. Over 5,700 unique soil types have now been identified, which are mapped in 16,000 different soil map units, each with its own unique combination of soils, and different soil layers to 1 metre depth. We have also significantly expanded the representativeness of soil reference sites across New Zealand; for example, by moving from 313 sites with soil water storage measurements to over 700 sites. This is a substantial public investment (about $10,000 per site), so we have invested to secure the data for future scientists in the National Soil Data Repository, which is one of New Zealand’s nationally significant intergenerational databases.
S-map data are very widely used. They are in demand from scientists for erosion, crop production, attenuation pathways, irrigation, and other hydrological research. S-map data are now extensively used in farm environmental planning, monitoring, and reporting: 64,000 web requests for soil information from the OverseerFM nutrient budget tool have been made over the past 12 months. S-map geospatial data are supplied directly to an expanding list of clients, including fertiliser companies, a dairy company, most regional councils, and banks.
S-map data are also a critical input in the NZ Water Model (NIWA), the NZ Drought Index (NIWA), IrriCalc (Aqualinc), and the OverseerFM nutrient budget tool. All these tools provide information to public organisations and private endusers across New Zealand.

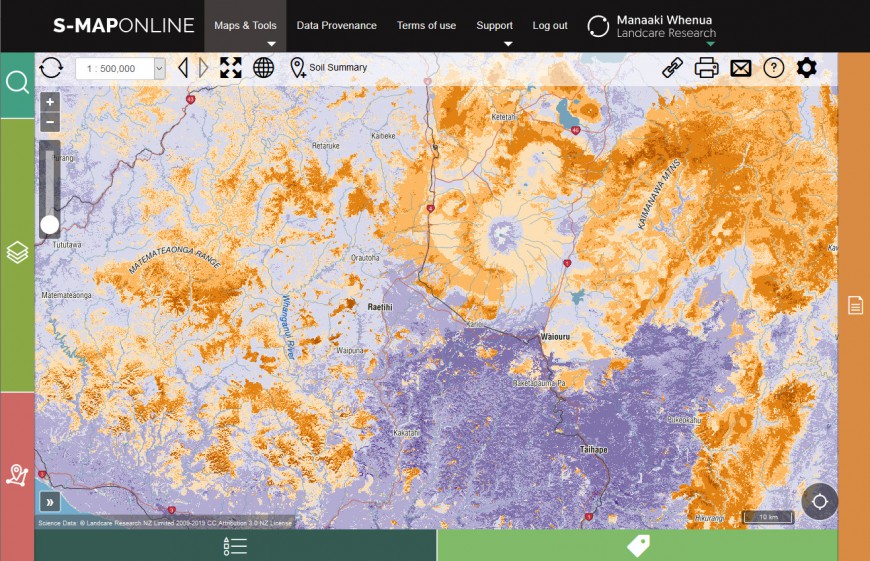
S-Map Online, showing soil pH layer information


