Multi-sensing platform SCANS
These methodologies are characterized by the ease, speed, low cost, and minimal pre-processing requirements to enable analysis of many samples. The array of information in a single spectrum and the ease and rapidity of analysis are extremely valuable new ways to study soil complexity. Combined with sophisticated statistical calculations for chemical compositions, spectral analysis of soil samples achieves a level of accuracy that approaches conventional laboratory analysis (Fig. 1). This method has now obtained official recognition from policy makers as an accepted method for soil organic carbon analysis. Yet, like any other proximal soil-sensing techniques, diffuse reflectance spectroscopy only records a part of the soil’s amazing complexity; each soil sensor provides a unique but limited method to investigate soil. However, the current advances, the accessibility of robotics, miniaturization and programming, and the combination of complementary sensors in a multi-sensor platform open new approaches and areas of research. Combining sensors and data integration can enhance the efficacy of the singular approach and broaden the perspective of soil analysis.
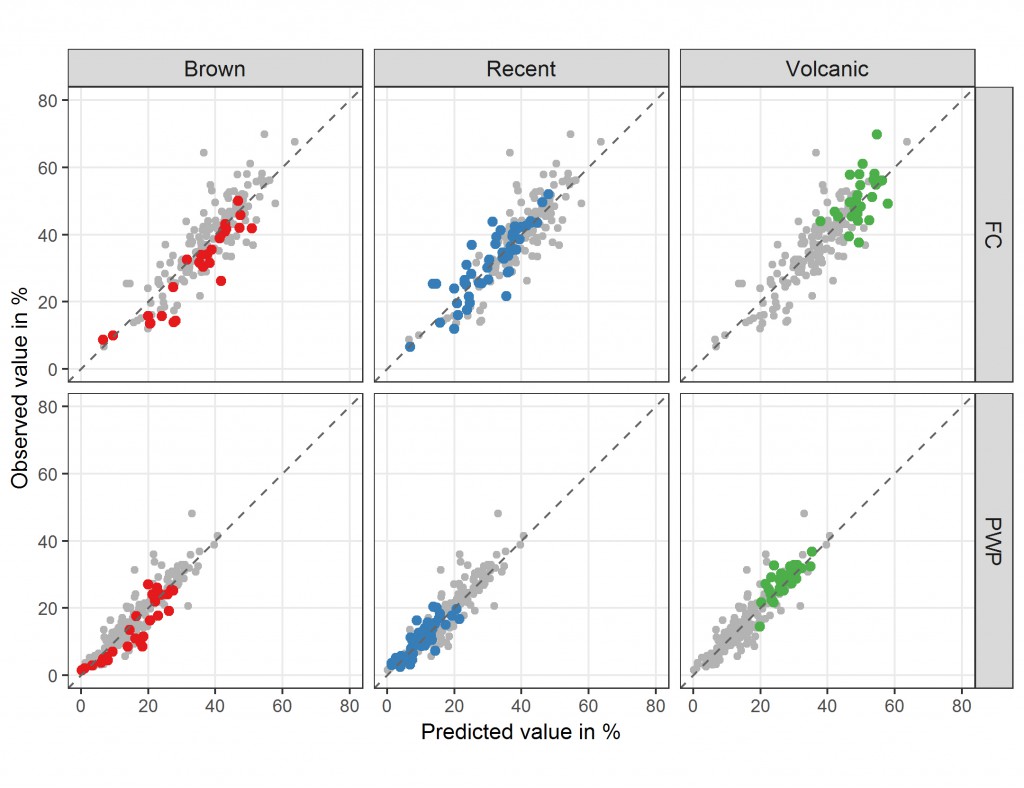
At Manaaki Whenua – Landcare Research, our pedometrics team is trying to encourage the adoption of diffuse soil spectroscopy and proximal soil sensing as valuable support for other soil projects. An impressive array of instruments and sensors, used either in the field or for laboratory analysis, is available to support soil projects. Vis-NIR and MIR spectrophotometers, combined with the extensive Manaaki Whenua soil database, are used to develop calibration models for soil chemical and physical property estimation. For example, Michael Blaschek has recently developed a spectral model to estimate plant-available water from Vis-NIR spectral analysis of air-dried and 2-mm sieved soil samples with a high level of accuracy (Fig. 2). Spectral models for organic carbon and clay content are currently being developed.
Sensor survey methods, including electromagnetic induction and gamma-radiometrics sensor survey systems, are available to be used for field survey, to map soil variability, and for zoning. This field survey approach aims at early detection of spatial soil variability and sampling design optimization.
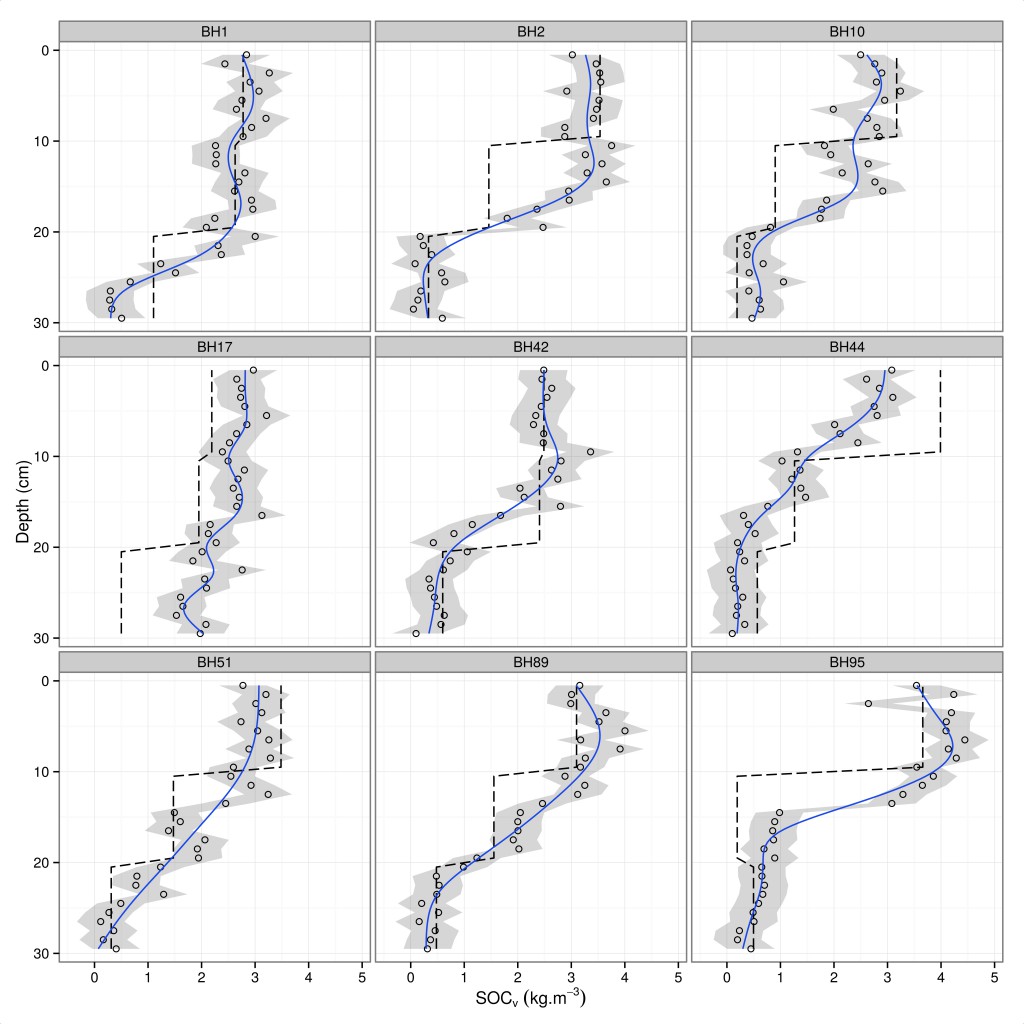
As part of a trans-Tasman collaboration supported by a New Zealand Government Global Research Alliance project, CSIRO, in collaboration with Manaaki Whenua, designed and developed the Soil Condition Analysis System (SCANS), a multi-sensor platform, deployable in the field that combines a Vis–NIR spectrophotometer, a gamma-ray densitometer, and a CCD camera. SCANS is currently operating in our Palmerston North Soil Carbon Laboratory. The SCANS platform allows high resolution scanning of intact soil cores in their field condition, with no pre-processing required. The densitometer measures bulk density and the Vis-NIR spectrometer simultaneously collects spectra for predicting a range of soil properties (Fig. 3). The rapid acquisition of bulk density data enables direct volumetric measurement of soil components. We can, therefore, predict volumetric soil carbon from which we estimate soil carbon stocks. In addition, through the analysis of the spectra, we can estimate other properties such as pH, cation exchange capacity, and clay content. We are currently employing the SCANS in different projects, from soil organic carbon stock assessments at national scale to soil carbon sequestration studies at paddock scale, in a worldwide effort to mitigate climate change. And this is just the beginning, because the spectral profiles from analysed soil cores can help investigate other soil characteristics, such as phosphorus retention and plant available nitrogen, to provide critical new point data to national soil mapping and other research efforts.

Figure 3: SCANS outputs: gamma-ray profile, Vis-NIR spectra and soil core pictures. For each gamma-ray measurement there is a corresponding Vis-NIR spectrum.undefined