A tool for better soil sampling
It is widely understood that field data have to be representative to be of value. This means that the field data must be typical for the range of soil types and properties that are being sampled. For example, if we want to estimate some property (e.g. pH, carbon, Cd concentration) from soils in the high country grasslands, then field data should all be from high country grasslands, with characteristics that should broadly match those in the whole population. In other words, the field samples should be an accurate reflection of the population from which the sample is drawn.
While representativeness is required, it is not obvious exactly where the field samples should be placed, even if we are able to identify soils that are typical of those that need to be measured. Another essential requirement is randomness, which ensures that we avoid an unconscious bias that can arise when samples are chosen purposefully.
A common method of selecting field sampling sites (simple random sampling) randomly selects a map location, then checks to see if the location is in an area that has the representative pedological characteristics of the soil we are interested in. If it does, then that point is chosen for field work, if not, then the process is repeated until another suitable point is found.
Simple random sampling (SRS) is straightforward and easy to understand, and is very widely used. However, it is not always the best approach since it fails to consider other information that may be available, and SRS may require more samples than other more complicated sampling approaches for the same benefit.
One class of methods generates samples that are purposely designed to be well-spread over the study area, broadly known as spatially balanced designs. Balanced sampling methods ensure that all areas are considered for inclusion in the field work, and generally fewer field samples are required when compared with simple random sampling. Two of the most popular methods within balanced sampling are Generalised Random Tessellation Stratified (GRTS) sampling and Balanced Acceptance Sampling (BAS). The philosophy behind balanced sampling methods is that if we want to estimate some overall property over the landscape, such as the mean soil carbon, then that estimate will be most useful if the samples from which it is estimated cover all areas of the spatial region of interest.
SRS, GRTS, and BAS are but three of dozens of sampling methods that could be used to select field sites, each with their own advantages and disadvantages. Choosing between these methods is bewildering for the field scientist, who frequently wishes to select sites for field work, subject to some budget of time and money.
A survey of sampling requirements from recent projects within Manaaki Whenua – Landcare Research suggested that field scientists preferred tools that enabled them to understand and visualise sampling decisions that were made for their area of interest. While the final design of a complex study might require a detailed analysis by a statistician, it was considered important that simple designs could be trialled by the field scientists themselves.
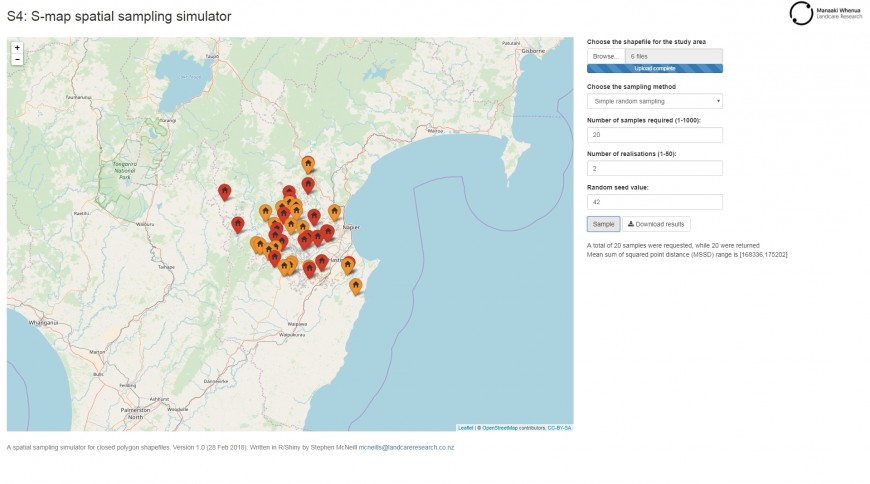
To make the choice of sampling methods simpler for a field scientist, we built a software tool that allows a user to load a GIS layer of their field site, and then try out various spatial sampling methods. This tool runs in a standard web browser (see Fig. 1), and the user does not need any special software installed on their computer. The application can even run on the web browser on a mobile phone.

Figure 1: Screenshot of the application; the exact layout will depend on whether the application is run on a large screen or a mobile phone. The sample locations for two realisations of 20 samples using simple random sampling are shown with red or orange markers for the different realisations.
Once sample points have been generated using the tool, simple statistics are displayed on screen, but most users would most likely wish to download and process the data separately. The data can be downloaded directly to an Excel spreadsheet, with the sample locations returned in both geographic (WGS84 latitude and longitude) as well as New Zealand Transverse Mercator (NZTM) coordinates.
The tool has a number of limitations, which may be changed in the future according to user demand. Sometimes, a field scientist will require samples in different groups or strata (perhaps different soil orders), spread over space. Our tool can only sample one group at a time, so stratified random sampling requires additional effort. It is also assumed that the number of required field sites is known beforehand, usually constrained by a project budget, so an analysis of the statistical power is not provided. Finally, one limitation is that the shapefile must lie within New Zealand, simply because exporting of coordinates to NZTM is only valid in this region.
From a user’s perspective, the application is run using the web address https://mcneills.shinyapps.io/spatialsampler. The area within which the samples are to be gathered must be defined by a GIS polygon layer in shapefile format, which is properly georeferenced.
A number of future enhancements are being considered for the online tool. These include extending the methods to stratified designs, new diagnostics to compare methods, and adding the ability to take historic field work into account.
Funding
This research was funded by the Ministry of Business, Innovation and Employment’s Science and Innovation Group.
