The data needed to estimate the hydraulic properties for these applications can be difficult or costly to gather directly from detailed field and laboratory measurement for each management task, and it is more common to use modelling to estimate the properties. These models range from very simple summaries by soil type (e.g. available water for each soil order), to more sophisticated models that account for soil type, texture, soil layer, and other properties that may be available.
A recently developed model for soil hydrological properties in New Zealand developed by Manaaki Whenua – Landcare Research uses information available from S-map, and estimates common properties in a consistent and physically plausible manner. For example, field capacity and wilting point estimates are available for S-map polygons, but in addition available water estimates (defined in terms of the difference between field capacity and wilting point) are also modelled so that the estimated value is always positive. Modelling soil properties in this way ensures that the estimated properties have sensible values – never below zero, for instance.
While it is important to model soil properties correctly so that the values are physically sensible, it is also important to know how accurate the estimates are likely to be. Modelling accuracy, or more correctly the uncertainty of the estimates, usually arises from the structure of the model used to perform the estimates, so the details are frequently mathematical. But the uncertainty estimates themselves depend critically on field data, and how those field data relate to the range of soils one might expect to encounter over New Zealand. For instance, if there are many field samples for one soil type but relatively few for another, we would expect larger uncertainty of estimates for the second soil type. When modelling involves many factors, such as soil type, texture (sand, silt, and clay), soil layer information, and so on, it can be difficult to visualise how uncertainty estimates change across the landscape.
For the S-map soil hydrology models, the estimates of soil properties are built from data in the National Soils Database (NSD), which has detailed soil-hydrology measurements from several hundred sites around New Zealand, all of which have matching S-map descriptions. However, these data are unbalanced, with 240 non-Allophanic Brown samples (for example), but only 40 Pumice samples.
One way to express uncertainty is to estimate the average root mean squared error (RMSE) for the property (e.g. field capacity), expressed as a percentage of the estimated value, and calculated separately for each soil order. For the S-map soil hydrology models, the RMSE is about 8% of the estimated response value for all properties, regardless of the soil order. But this measure of uncertainty has its limitations: the RMSE is averaged over all samples in a soil order, so unusually high or low uncertainty is masked as a result.
A more practical approach to estimating uncertainty is to calculate the likely range of values that an estimate of the soil property might take, say 95% of the time, but calculated for every prediction that is carried out. While time-consuming, this approach conveys more practical information.
For example, consider estimating the total available water (TAW) for a (hypothetical) sample of non-Allophanic Brown soil with sand, silt, and clay content of 33.3, 33.3, and 33.3% respectively. The estimated TAW in this case is 16%, with a 95% confidence interval of [12,22]%. For Pumice soils with the same texture content, the TAW estimate is higher at 35%, but the 95% confidence interval is [10,72]%, which is over six times wider than the uncertainty for the non-Allophanic Brown soil.
There are several reasons for the difference in the uncertainty in the case of non-Allophanic Brown and Pumice. First, there are far fewer Pumice samples (40) in NSD with soil-hydrology field measurements when compared with non-Allophanic Brown samples (240). Second, the texture range of the Pumice soils is narrower, with NSD samples having a sand content of 35 to 91% and clay from 0 to 25%, while for non-Allophanic Brown NSD data the sand content ranges from 0 to 100% and clay from 0 to 70%. So, for the case of Pumice, estimating TAW means extrapolation beyond the range of the available field data. Fortunately, in this case the confidence interval enables us to detect that the TAW estimate is inaccurate.
One way to visualise the uncertainty is to plot the TAW estimates and the 95% confidence intervals for both non-Allophanic Browns and Pumice soils over the soil texture triangle (see Fig. 1). The estimates are presented in Figure 1 as contours as well as colours. The predicted TAW uncertainty for non-Allophanic Browns shows little variation over the most of the texture triangle, except for low sand/high silt content. By contrast, the uncertainty for Pumice soils is at least twice as large, and the estimated uncertainty increases as the clay content increases. Using these uncertainty calculations, it is possible to have some confidence in the integrity of the estimates of soil properties, and we know when we ought to reject the prediction as being too inaccurate for practical use.
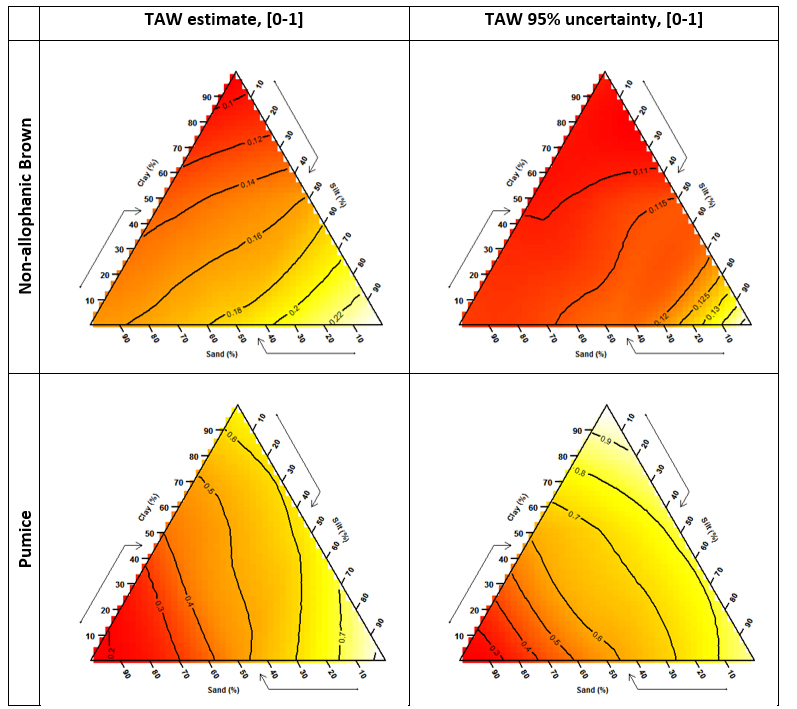
Figure 1. Estimates of total available water (TAW, L) and estimated TAW 95% uncertianty (R) for non-allophanic Brown soils (upper row) and Pumice soils (lower row). Contours provide values of the TAW and confidence interval (0-1, or 0-100%) and the colour also indicates the magnitude of the estimate (from red to yellow.
How can the problem of wide uncertainty limits be fixed? Better modelling helps, but the real solution is to gather more field data across a wider range of sites across New Zealand, especially for soil types where there are few available NSD samples, such as Granular, Pumice, and Oxidic soils.