Turbidity is a measure of cloudiness in water due to light scattering by suspended particulate matter and is often used as an indicator of SPM. Turbidity is also often used as a relative index of water clarity which depends on light scattering. Consequently, turbidity sensors are key instruments in the fields of water quality and erosion-sediment management.
The relationship of SPM to turbidity depends on particle size and other properties of SPM. So, turbidity is routinely (locally) calibrated to SPM concentration. However, turbidity is often recorded as such (in FNU – formazin nephelometric units) when what is really needed is a measure of water clarity – which is not reliably indicated by turbidity unless locally calibrated. Use of turbidity data is compromised because different sensors give numerically different outputs even when calibrated identically to formazin.
An international standard, ISO 7027 (specifying measurement of scattering of near infra-red radiation centered on 90 degrees), was introduced to improve comparability of turbidity data. However, different ISO 7027 turbidity sensors operated side-by-side in the Mataura River in Southland were still found to vary appreciably in numerical response. As an outcome of a NZ Hydrological Society Technical Workshop in 2017, where issues of turbidity sensor comparability were raised, a series of tank experiments were conducted to compare the outputs of several different ISO 7027 turbidity sensors that are commonly used in NZ.
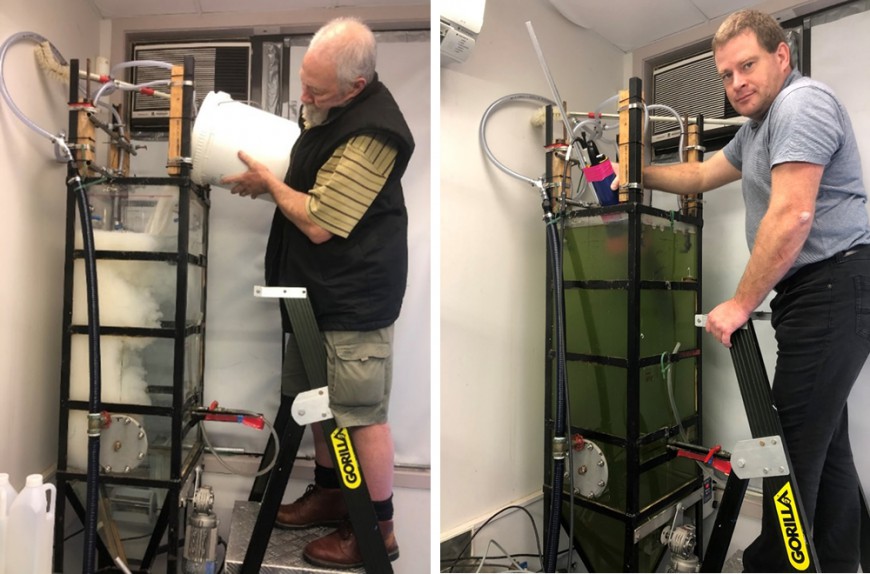
Figure 1. A. Adding a turbid slurry of the layer clay mineral, kaolinite, to the turbidity sensor testing tank. B. Deploying an EXO2 sonde (fitted with three turbidity sensors) in the testing tank – which contains pond-water laden with green algae.
We tested four different field-type turbidity sensors. commonly used for river monitoring in NZ, plus two cuvette instruments for analysing discrete water samples. A large (170 L volume) well-mixed laboratory testing tank was used for the experiments (Figure 1). The sensors were tested over approximately a 100-fold concentration range in river silt, kaolinite (a layer clay common in NZ soils and rivers – Figure 1A), and algal-laden pond water (Figure 1B).
All the sensors were calibrated before and after tank testing with freshly-made formazin standards so as to compare them on the same basis. We measured concentrations of test suspensions both in terms of total suspended solids (TSS; g m-3) and light beam attenuation (beam-c; m-1) measured in the laboratory by beam transmissometer (Figure 2). Beam-c is strongly inversely proportional to visual clarity (and proportional to SPM concentration), giving the metric immediate practical meaning.
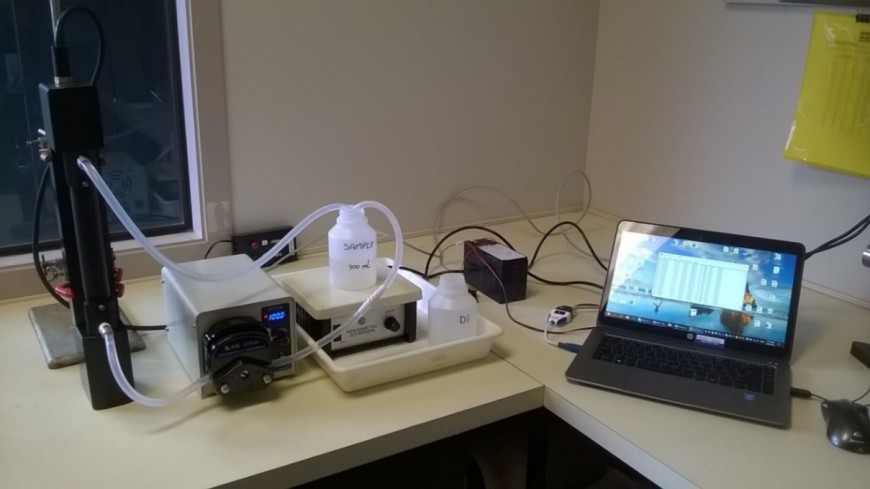
Figure 2: WET Labs® C-Star beam transmissometer set up in flow-through mode for laboratory measurements of beam attenuation coefficient (beam-c). Left to right: C-Star sensor (black item) with flow-tube fitted, peristaltic pump, diluted sample (stirred by magnetic stirrer), and laptop computer running Terra Term web 3.1. The C-Star sensor emits a collimated beam of green light (530 nm) and measures the fraction transmitted through the water sample.
We found that the outputs of different ISO 7027-compliant turbidity sensors (in ) were strongly linearly related, but ranged about two-fold in magnitude in all three tested suspensions. Figure 3 shows data for river silt by way of example. Plots for kaolinite and algae were broadly similar, with the Hach 2100Q-is cuvette turbidimeter reading consistently high, the YSI EXO2 sonde turbidity consistently low, and other sensors having intermediate responses as shown in Figure 3.
Apparently, even for turbidity sensors meeting the same design standard (ISO 7027), setting instruments to read identically in formazin does not guarantee the same, or even similar, numerical output in natural suspensions. The variation in sensor response seems to arise from small design differences between instruments combined with the very different light scattering properties of natural SPM compared with formazin.
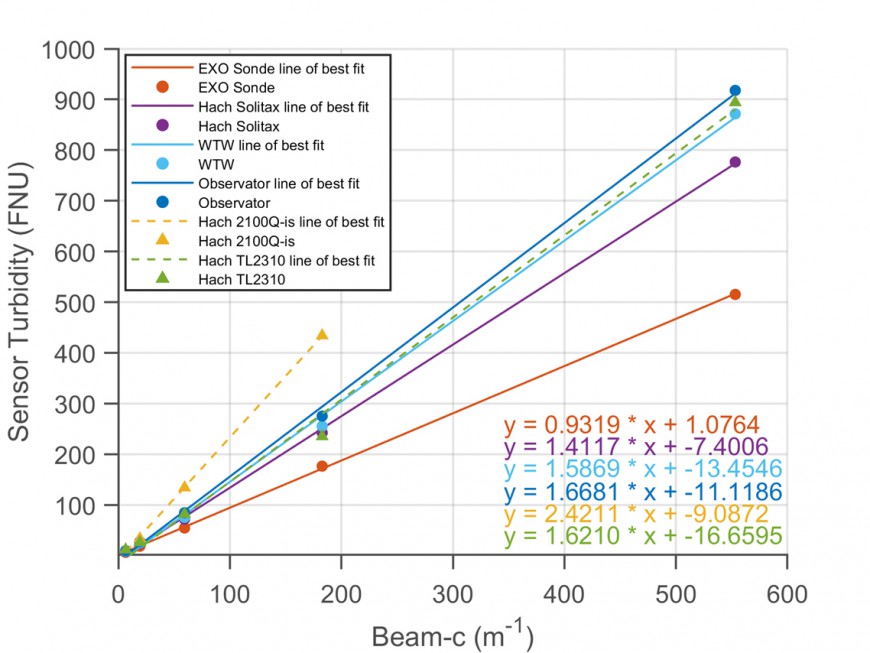
Figure 3. Response (FNUs) of ISO 7027-compliant turbidity sensors in river silt. Beam-c is the beam attenuation coefficient (measured by WET Labs C-Star beam transmissometer in flow-through mode) to provide a reference optical concentration. (Field in situ instruments – dots with solid lines; cuvette instruments – triangles with dashed lines.)
Our finding of weak numerical comparability of different turbidity sensors, despite compliance with the ISO 7027 design standard, suggests that turbidity in FNU should not be treated as an absolute quantity. Turbidity is merely a relative measure of light side-scattering that usefully indicates relative SPM concentration or water clarity. To estimate actual (absolute) SPM concentration (e.g., TSS; g m-3) or water clarity (either visual clarity or light penetration) requires local calibration of the turbidity sensor.
Since turbidity is poorly comparable on different instruments, it follows that laboratory formazin-based turbidity measurements are of dubious value. Fortunately, laboratory turbidity can be replaced by absolute measurement of the light beam attenuation coefficient (beam-c) – the reference quantity in our experiments (Figure 3).
Based on these findings, we recommend that the common practice in New Zealand of removing field turbidity sensors for periodic laboratory recalibration to formazin is best abandoned. Instead, effort should go into locally calibrating field turbidity sensors to the variables of real interest – usually SPM or visual clarity. The resulting ‘rating curves’ permit continuous turbidity records to be converted to the variable of interest in much the same way that a stage-discharge rating permits continuous stage records in rivers to be converted to discharge. Turbidity sensor drift can be conveniently checked on-site by fairly precise measurement of visual clarity alongside the continuous sensor. We expect it should be entirely possible to dispense with the traditional reference material, formazin – a hazardous substance that is inconveniently unstable at lower concentrations.
Because turbidity data are “numerically ambiguous”, turbidity is not suitable as a metric in studies of the effects of fine SPM on aquatic life (TSS or visual clarity or light penetration might be appropriate, depending on the mechanism of SPM stress on aquatic animals or plants.) Likewise, turbidity is unsuitable as a metric in environmental standards. We may note that NZ’s National Policy Statement for Freshwater Management (NPS-FM2020) gives standards for visual clarity in waters to protect aquatic life (at Table 8), but not turbidity – because of very valid concerns about the comparability of turbidity data.
MBIE Envirolink funding of the experiments is acknowledged, and the work, including a journal article, is being completed with funding from the STEC Programme.