A farmer-friendly infiltrometer
We designed a farmer-friendly infiltrometer to meet these specific user requirements. It uses a built-in touch screen to activate the device by a single touch, and displays infiltration rates without having to edit or enter details. Our smart design needs few precision components, resulting in a cost-effective manufacturing process.
The infiltrometer calculates the infiltration rate by measuring the rate of change of water volume required to maintain a constant thin water layer inside the container ring. Traditional infiltrometers measure this water volume by sensing the water level in the ring using a set of electrodes. Measuring the water level change inside the water cylinder is done using a precision differential-type pressure transducer.
The difference with this new design is the use of a precision dosing pump, which can inject a known and constant volume (+/–0.1 mL) into the container ring, rather than using a pressure transducer to measure the water level change in the water cylinder. The injection process continues until a steady state is reached, and the time taken for one infiltration measurement depends on the type of soil.
The time taken for the constant water volume to be absorbed by soil is usually very fast at the start, depending on the antecedent conditions. The rate of absorption diminishes with time and reaches near steady state as the rate curve levels off just above zero as the soil surface reaches saturation. It takes a long time to reach a constant infiltration rate, so the user must decide when to terminate the test by judging the shape of the infiltration curve on the LCD display.
Following is a summary of the new infiltrometer’s features.
- The user activates the device by a single touch to select the ring size.
- Infiltration rates are displayed on the touch screen as a time-series chart.
- Users can leave infiltrometers at many different locations and return to collect the data. The device is small enough to carry in a backpack.
- Water can be stored in a standard water container.
- Time series data are extracted for soil-water modelling by connecting a smartphone app to the device via Bluetooth. (The user can either email or copy the data file from the phone.)
- Only a small, external battery, preferably rechargeable, is required. These are power efficient, using 90 mA continuously and 1.5 A when the dosing pump is activated for 10 seconds.

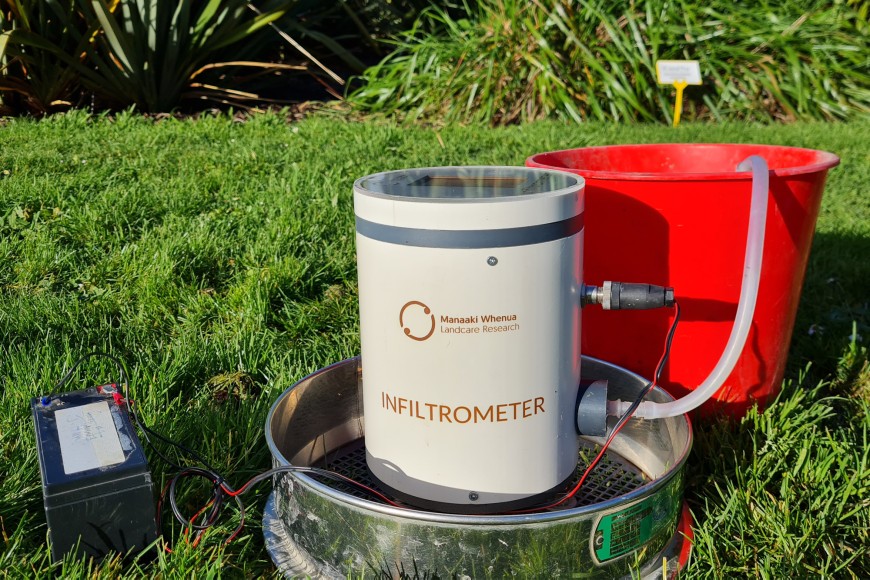
Figure 1. Setting up the infiltrometer requires only three simple steps. The water container and battery are commonly found in hardware shops. The infiltrometer is small enough to carry in a backpack.
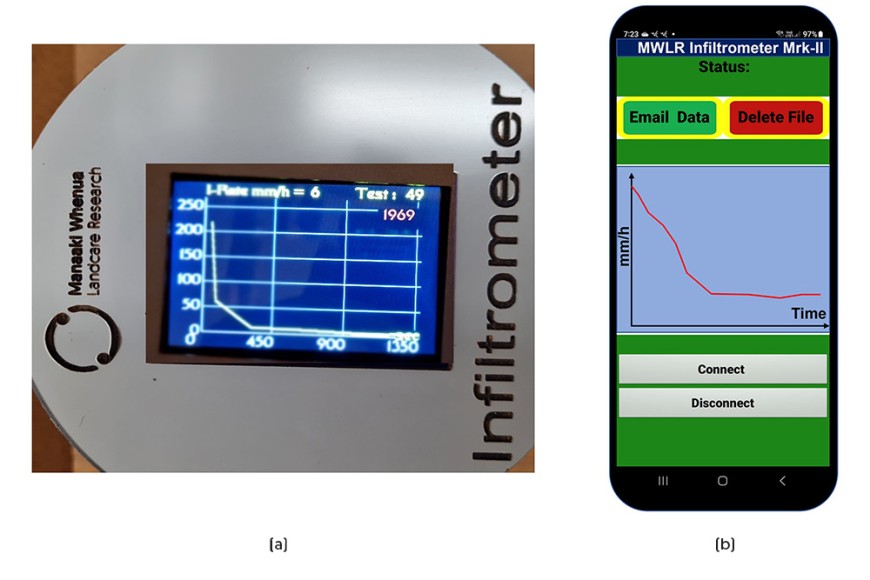
Once activated, the infiltrometer displays the infiltration rate and test number on the touch LCD display, as shown in Figure 2a.

Figure 2. (a) Display of infiltration rate time series, with the test number at the top. (b) Infiltration rate in mm/h is shown on the y axis against time in seconds on the x axis. For research purposes, raw data can be exported using a smartphone app when the device reaches cellular coverage.
If raw data are required for further numerical modelling work, a smartphone (Figure 2b) can be connected to the infiltrometer via Bluetooth, allowing the time-series data to be downloaded to the phone or emailed to the user (when the infiltrometer reaches areas with cellular service). Old data files can be deleted while the infiltrometer is connected to the phone. Previous data must be deleted to refresh the screen display for the new test. However, all test result time-series data will remain in the infiltrometer SD card for the lifetime of the device.
We carried out lab and field tests, with excellent results. The most important feature of the new infiltrometer design is that it is very simple to find the steady state infiltration rate of a soil. This will be very useful for farmers when deciding on the best irrigation application rates for time-varying infiltration rates due to different farm activities.

